
You invest money in advertising, see traffic growing — but sales stay flat. At this point, many online business owners start “twisting the ads”: changing creatives, audiences, bids. But very often the problem isn’t the ads. It’s what happens after the click: users get lost, get irritated, don’t see the next step, or hit technical issues.
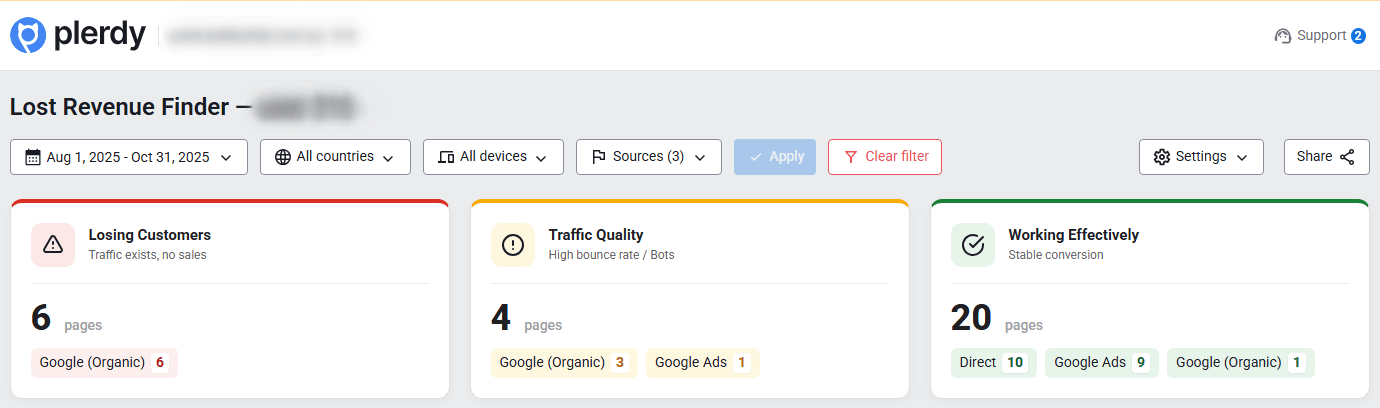
That’s exactly why Plerdy has the “Lost Revenue Analysis” report (lost revenue is potential income you could have earned but didn’t because of traffic or page issues). It helps you quickly pinpoint where money is leaking — whether it’s traffic quality or on-page problems — and understand what to fix first.
Who The “Lost Revenue Analysis” Report Is For
This report is especially useful if you are:
- an eCommerce store owner (an online store is a website with a cart and online payments);
- running a services website (a services site is where the main goal is a lead, call, or consultation);
- growing a SaaS product (SaaS is a subscription-based service where conversion can be registration or payment);
- using mixed marketing: paid ads + organic + email/messengers.
What “Lost Revenue Analysis” Is And How It Differs From Standard Analytics
Traditional web analytics usually answers the question “what happened”: how many users came, what percentage converted. “Lost Revenue Analysis” answers “why” — by combining:
- performance metrics (for example, conversion rate — the percentage of sessions (a session is a single visit) with a goal completion),
- behavioral signals (for example, no-click sessions — the share of visits without a single click),
- automatic insights (for example, “traffic issue” or “page issue”).
This is a report that helps you prioritize (prioritization is choosing tasks with the highest impact on revenue): instead of “improving everything,” you hit the exact leakage points.
What Data You See In The Report
Landing Pages And Key Metrics
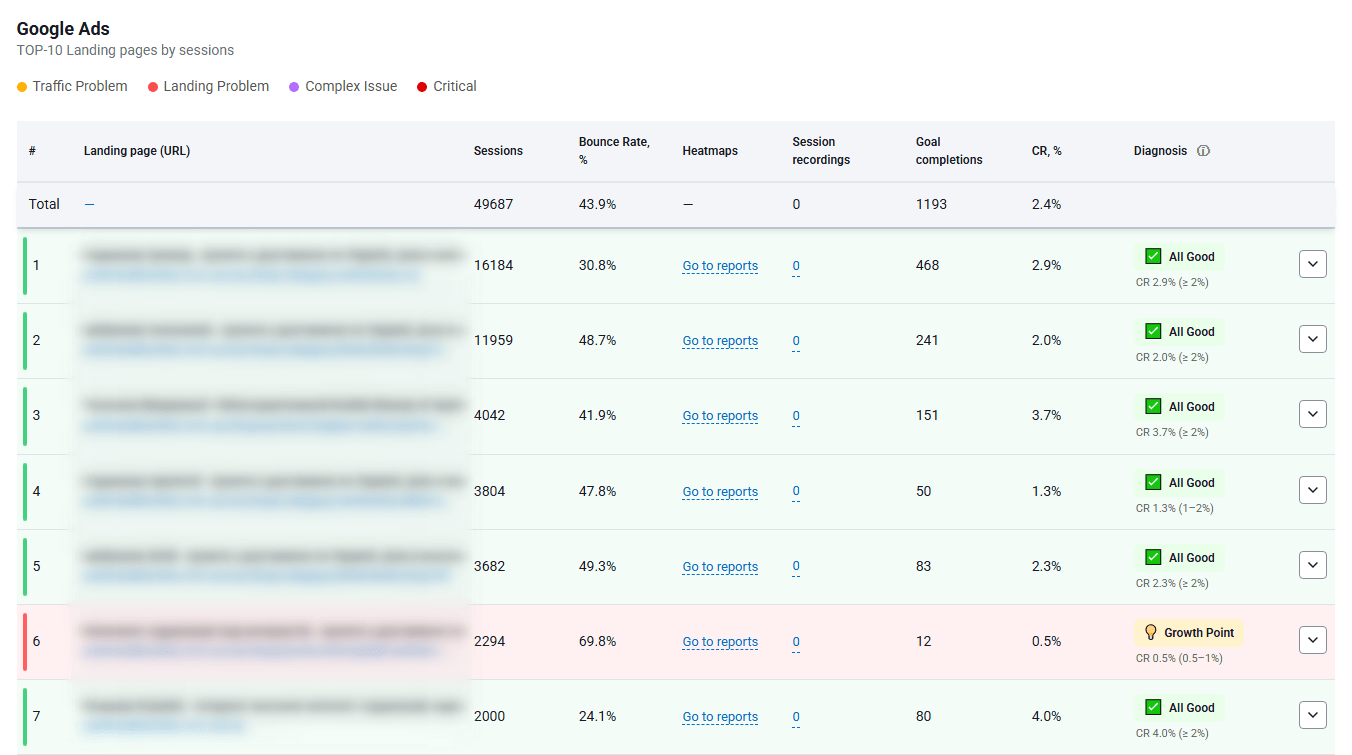
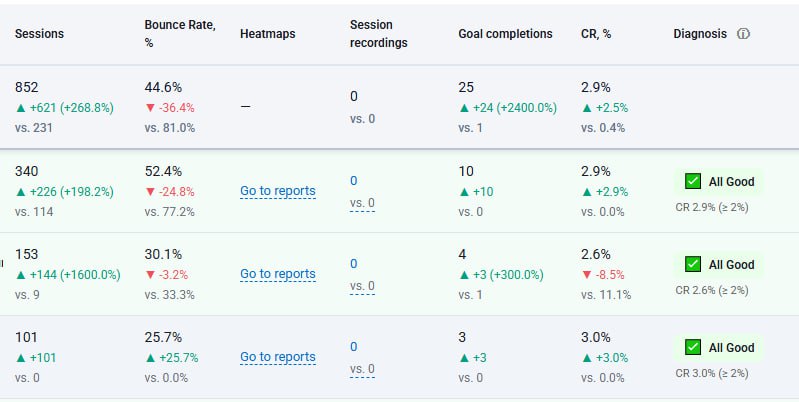
The report analyzes landing pages (a landing page is the page where a session starts) and shows how they perform in numbers:
- Sessions (a session is one user visit to the site during a given period).
- Bounce rate (bounce rate is the share of sessions where a user quickly leaves the site without interaction).
- Goal completions (goal completion is the number of times users performed a defined target action).
- Conversion rate (conversion rate is the percentage of sessions that ended with a target action).
- Diagnosis (diagnosis is the system’s automatic conclusion pointing to what looks like the main issue).
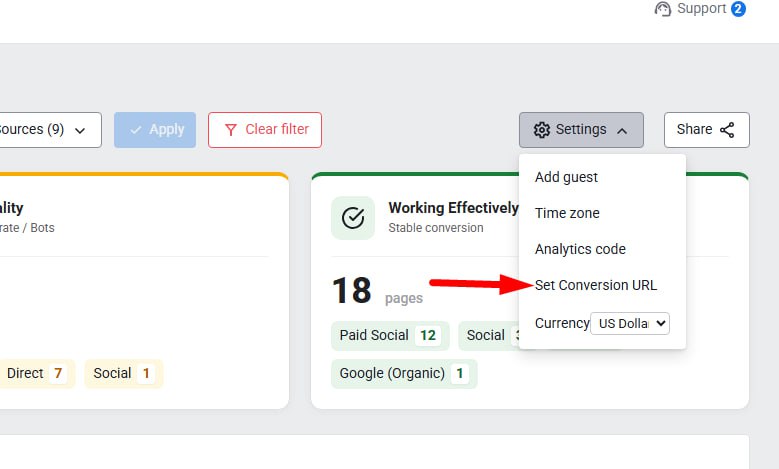
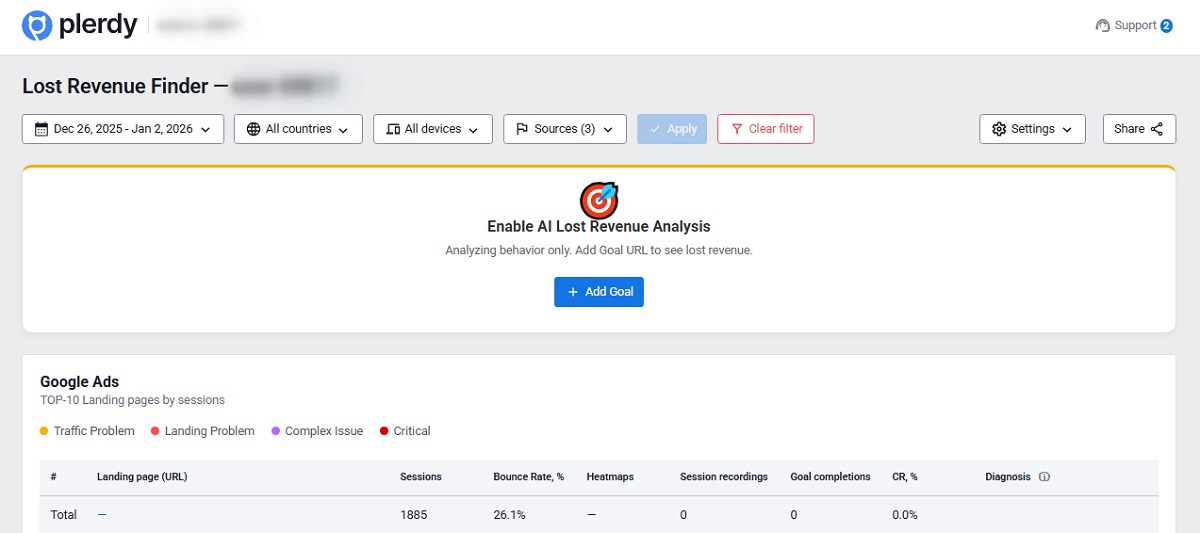
Critical Step: Set Up A Conversion Page
For the report to correctly calculate “lost revenue,” you must specify a conversion page (a conversion page is the URL that confirms a successful action, such as “Thank you for your order,” “Payment successful,” or “Form submitted”).
Without a conversion page, the report can see behavior (bounces, clicks, scrolls) but cannot fully evaluate where the path to purchase breaks.
“Smart Insights”: How The System Finds Problems Automatically
The report includes a smart insights block (smart insights are automated tips that explain why a page or traffic source looks problematic and what to check).
Main Diagnosis Types (And What They Mean)
- Traffic issue (traffic issue means irrelevant users are coming, leaving fast, and barely interacting).
- Page issue (page issue means users interact but don’t convert: there’s a barrier in the offer, trust, or usability).
- Budget loss (budget loss means paid traffic exists, but conversions don’t: money is spent, results are zero).
- Technical issue (technical issue means elements work incorrectly, preventing users from completing an action).
- Mismatch (mismatch means the ad promise doesn’t match the page content).
- Conversion barrier (conversion barrier is a specific obstacle on the way to purchase or lead).
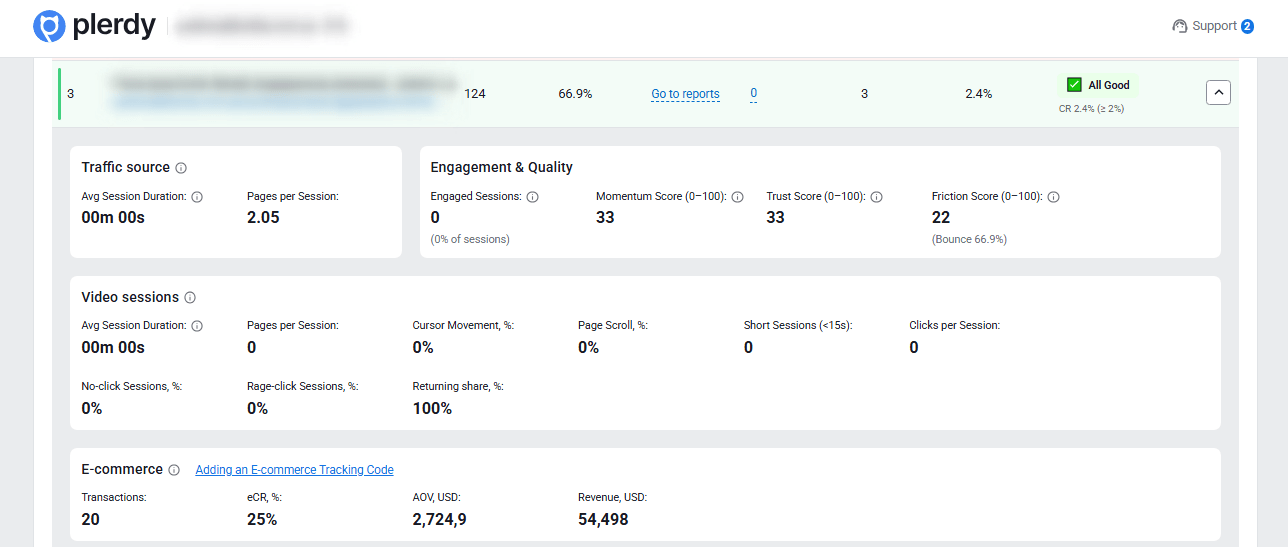
Advanced Behavioral Metrics: How To Understand “What Hurts Exactly”
- Page scroll, % (scroll is moving down the page; shows whether users reach key blocks).
- Short sessions (<15 seconds) (short sessions are visits shorter than 15 seconds; often signal wrong expectations or a weak first screen).
- Clicks per session (clicks per session is the average number of clicks per visit).
- No-click sessions, % (no-click sessions are visits without any clicks; a signal users don’t see the next step).
- Aggressive click sessions, % (aggressive clicks are repeated “nervous” clicks on an element; a signal of frustration or breakage).
- Returning visitors share, % (returning visitors are users who come back to the site; sometimes it’s trust, sometimes hesitation).
Scores 0–100: A Fast “Problem Thermometer”
- Friction score (0–100) (friction is anything that blocks action; the friction score summarizes page issues based on bounces, aggressive clicks, and no-click sessions; lower is better).
- Engaged sessions (engaged sessions are visits that aren’t short; users actively interact).
- Momentum score (0–100) (momentum shows “forward movement”: scrolling, clicking, and activity).
- Trust score (0–100) (trust is a combined readiness indicator: longer sessions, more page views, and higher return rate).
eCommerce Block: When You See Not Just Behavior, But Money
- Transactions (a transaction is a completed order or purchase).
- Purchase conversion rate (purchase conversion is the percentage of sessions that ended with a transaction).
- Average order value (average order value is the average amount per order).
- Revenue (revenue is total income from a page or segment).
How An Online Business Owner Can Use The Report In 30–60 Minutes
Step 1. Select A Date Range: Best Option — Last Month
At the top of the report, there’s a calendar (calendar is the date range selector). For a stable picture, choose a “month” period (a month is 30/31 days of data, enough sessions for solid conclusions), not 1–3 days with random noise.
Step 2. Set Up The Conversion Page
The conversion page (conversion page is the purchase or lead confirmation URL) is the foundation of the report.
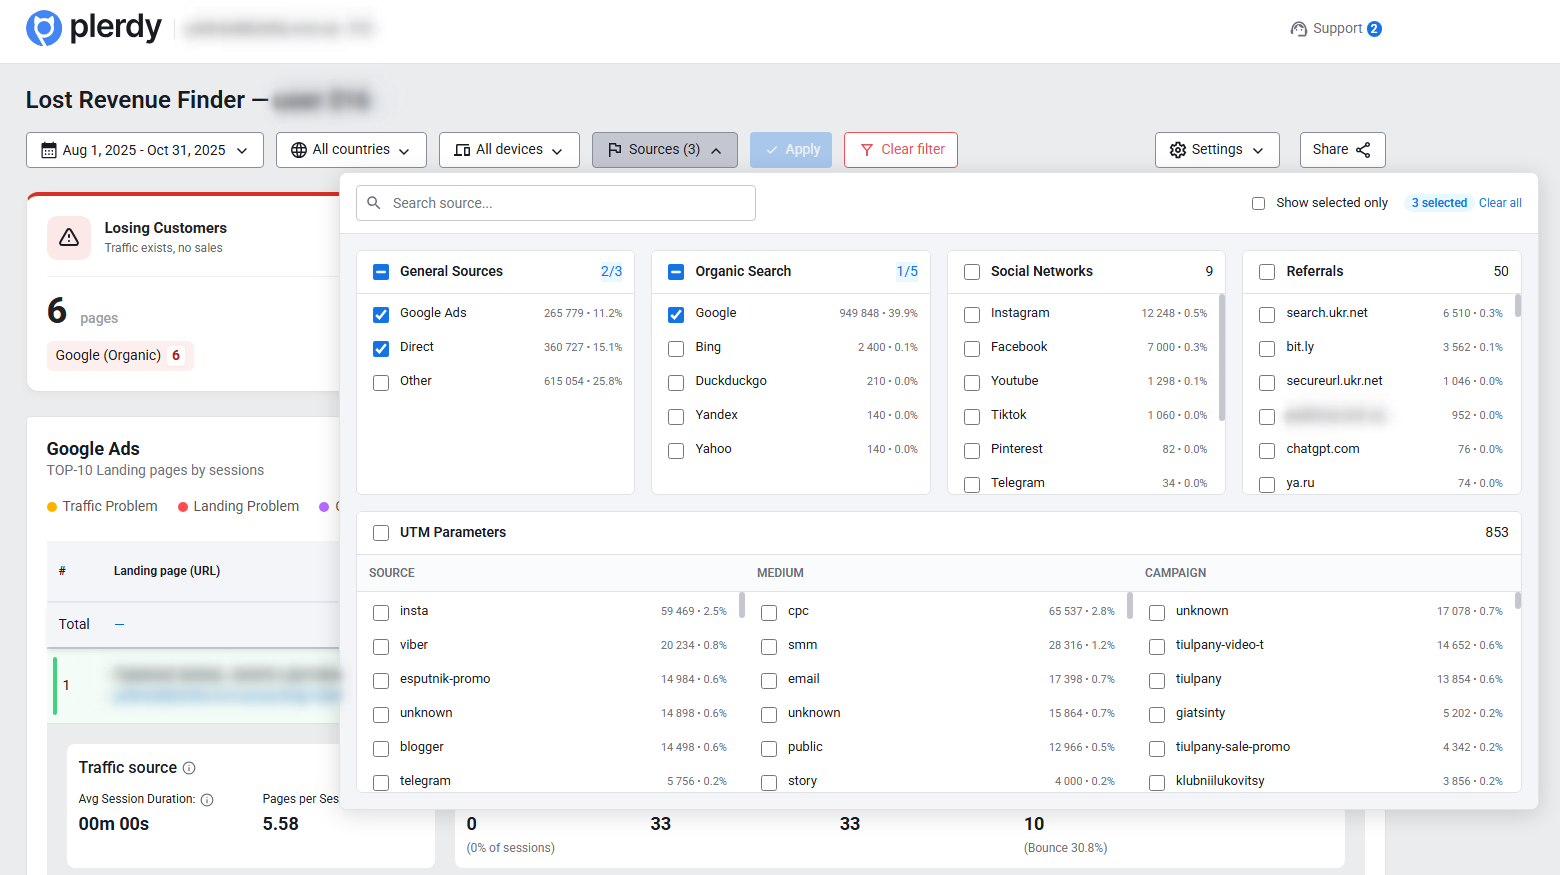
Step 3. Split Analysis By Traffic Channels And UTM Tags
This is where the most valuable truth often hides: the same page can perform very differently across traffic sources.
- Traffic channel (traffic channel is the visitor source type: organic search, paid ads, social media, email, etc.).
- UTM tags (UTM tags are link parameters that precisely identify source, campaign, and creative, such as utm_source, utm_medium, utm_campaign).
Why this matters: behavior differs. Search traffic is usually “warm” (warm traffic means users with existing intent), while social traffic can be “cold” (cold traffic means users without immediate purchase intent). As a result:
- cold traffic more often has higher bounce rates;
- warm traffic shows more engagement but may face other barriers (price, trust, delivery).
Practice: start with paid channels, then organic, then email/partners. Always compare pages by UTM if you run multiple campaigns to the same landing page.
Step 4. Separate Traffic Issues From Page Issues
- High bounce rate + many short sessions → usually a traffic quality problem.
- Scrolling and clicks exist, but few conversions → usually a page problem.
Step 5. Pick 3–5 Pages And Build A Fix Plan
A plan means concrete hypotheses (a hypothesis is an assumption like “if we change X, Y will grow”) and quick tasks: first screen, CTA, form, trust elements, speed, technical bugs.
Step 6. After Changes, Compare Results With The Previous Period
Comparison is your quality control. Take the same time interval (interval is the same period length, for example 30 days) and compare the current period with the previous one in the calendar (previous period is the 30 days before the selected range).
What to compare:
- conversion rate (percentage of sessions with a goal),
- goal completions (number of target actions),
- bounce rate (share of quick exits),
- friction score (page issue index),
- and for eCommerce — revenue and average order value.
What To Do Based On The Diagnosis: Quick Scenarios
The key principle: numbers show where it hurts; visual analysis shows what exactly is happening.
1. If It’s “Budget Loss”
- Check ad-to-page relevance (mismatch is when the ad promise doesn’t match what users see).
- Review the call to action (call to action is a button or text like “Buy,” “Get a consultation,” “Submit”).
- Then connect deeper analysis:
- Heatmaps (a heatmap visualizes clicks, movements, and scrolls to show what users actually notice and click).
- Session recordings (a session recording is a replay of user behavior: movement, hesitation, failed clicks).
2. If It’s A “Traffic Issue”
- Narrow targeting (targeting defines who sees ads) and review UTM tags to find the lowest-quality campaigns.
- Check heatmaps: passive behavior (almost no clicks or scroll) often means users came for the wrong reason.
- Watch session recordings to see users enter and instantly leave or search for something else.
3. If It’s A “Page Issue”
- Strengthen the first screen (the first screen is the visible part without scrolling): clear value, who it’s for, why to trust you.
- Simplify the path to action (path is the number of steps to purchase or lead).
- Use heatmaps to validate CTA placement and false clicks (false clicks are clicks on elements that don’t lead to a goal).
- Review session recordings to find hesitation moments.
4. If It’s A “Technical Issue” Or “Aggressive Clicks”
- Check elements with many aggressive clicks (aggressive clicks are repeated clicks when expected feedback doesn’t happen).
- Click heatmaps show where this occurs.
- Session recordings reveal the scenario: broken button, inactive form field, overlapped element.
Conclusion
Lost Revenue Analysis in Plerdy is a practical tool for online business owners who want to find funnel leaks (a funnel is the user path from entry to purchase) and recover money. The best results come from a combo: report → diagnosis → heatmaps and session recordings → quick fixes → impact validation.