
We have asked 36 UX specialists how they use heat maps for their user research process and better website UX and share what we learned from them in this report.
When you ask yourself how to make a website better, the clue to this question is that it’s all about users. Knowing your users means being able to make optimization processes that serve your users’ needs. So collecting user-focused website data and analyzing it becomes crucial for perfect UX.
Traditional analytics data like bounce rate, page views, and conversions are not giving us enough information and insights into the real problems and areas for improvement on the site. UX specialists during the UX research process seek to dive deeper and know where people look at, what elements they click on, and what they like and dislike.
Heatmaps hold the key to these deceptively simple processes and give an understanding of how to fix the problems and increase conversions.
So if you’re a UX designer, copywriter, developer, or marketer working on improving the website user experience, we prepared a study on how to use heatmap insights to improve UX and the metrics that matter to your business.
We have asked 36 UX specialists to share how they use heatmaps in their UX research process and are ready to share some valuable findings from this survey.
Analyze the user’s first click on the site pages
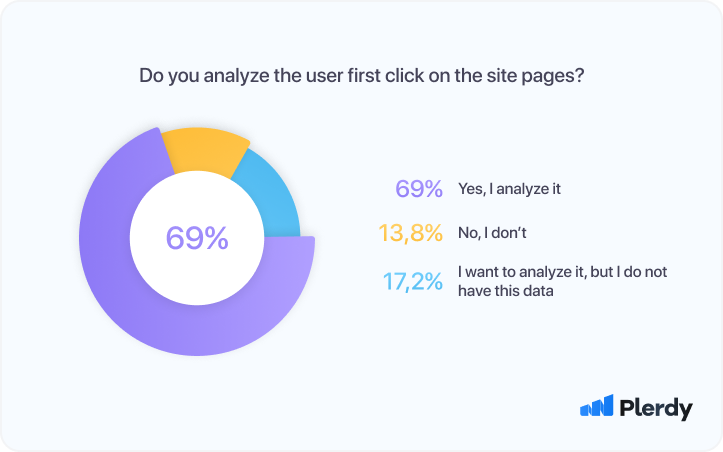
69% of respondents stated that they analyze the first click on the website, and another 17,2% want to analyze it as well but don’t have this data
When users land on the website, they want to find the information they are looking for quickly, so easy and understandable navigation is everything for online visitors.
The first click defines the route a user takes and plays the most important role in the overall customer journey on the site. Getting it right with the first click means being two to three times more likely to find what’s needed than going in the wrong direction with that first click.
By recording and analyzing wherever users click first, UX specialists can answer questions like:
- Which elements, buttons, content parts, language, and other navigational elements are the most intuitive for users?
- Which navigational elements do users not notice, misuse, or avoid altogether?
- Where is the best place to put things like buttons, shopping cart icons, menus, and other navigational elements?
Segment your heatmap data by traffic channels
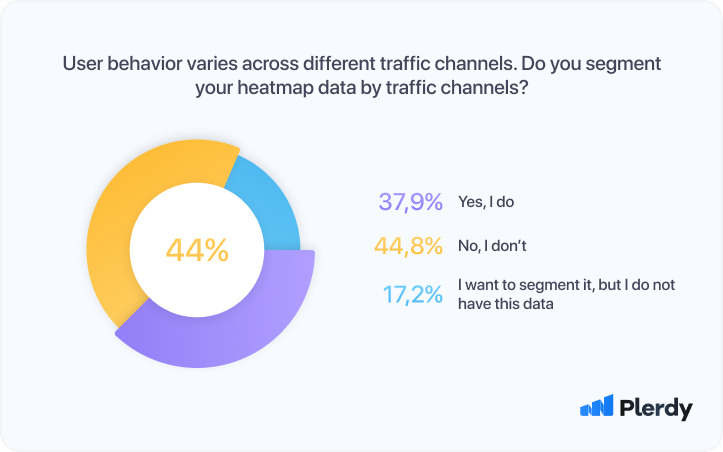
37,9% of respondents stated that they are segmenting the heatmap data by traffic channels during the process, and another 17,2% want to do it as well but don’t have this data
While many UX specialists during the UX research process look at the aggregated heatmap data and don’t dive deep into the traffic segmentation, it is known that the user profiles and intents might be very different based on the source of their visit.
With many traffic sources, it is useful to segment your heatmap data during the process and gain a better understanding of specific user groups. Knowing where your users come from is good, but knowing what those specific types of users are looking for can take your UX research to a new level.
The overall reports on the process give an answer to the question “WHAT” your users are doing on the site. In contrast, the segmentation (based on the traffic channel, device type, country, etc.) gives you the WHY behind specific user behaviors.
Analyze clicks on dynamic elements (sliders, pop-ups, tabs or other dynamic elements)
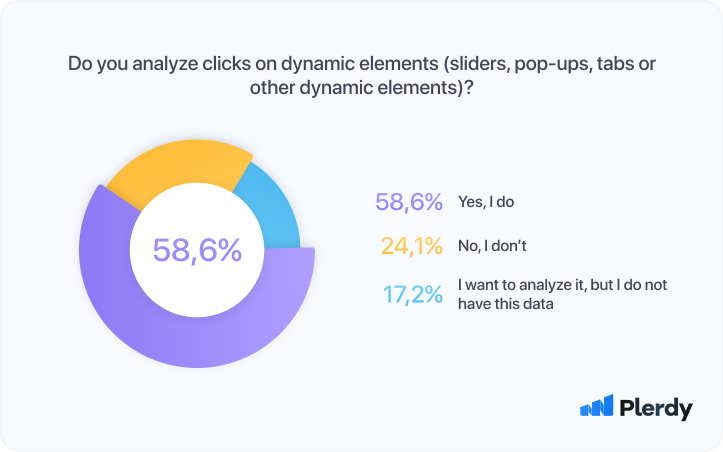
58,6% of respondents stated that they are analyzing clicks on dynamic elements during the process, and another 17,2% want to do it as well but don’t have this data
Dynamic elements are great. They can be used in many ways during the process to add personalization, decrease bounce rates, and increase conversion and engagement. For example, adding something like a scrolling marquee, rotating header banner, case studies, testimonials, and expandable content (i.e., clicking on “read more”) can be much more effective than static elements and forcing the user to scroll down to view everything.
However, as the research process shows, it is super important not to overdo the moving elements on your website as there is a tricky part. A little is great! But if it is too much, your audience will get an eye ache and browse elsewhere.
So make sure to know the limits and have your dynamic elements helpful rather than irritating. They should also be intuitive for users to understand how this element works and where to click.
Not all heat maps software records the clicks on dynamic elements during the process of researching, so when choosing a tool for your UX research process, add this feature to your must-have list.
Analyze the scroll depth on the site pages
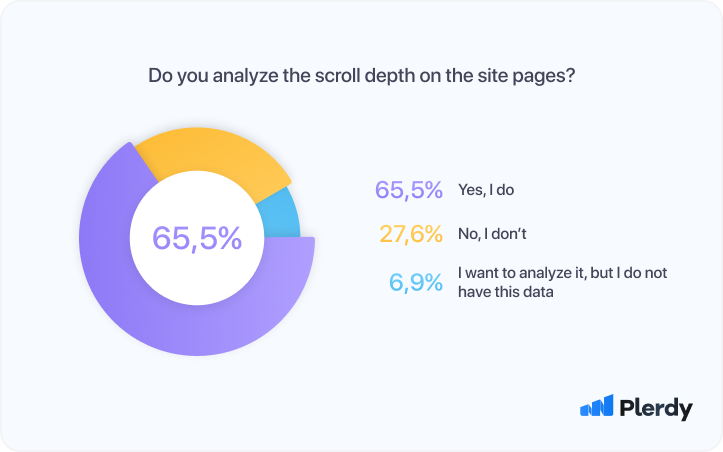
65,5% of respondents stated that they are analyzing clicks on dynamic elements during the process, and another 6,9% want to do it as well but don’t have this data
Scroll depth analysis in the UX research process is extremely helpful in measuring the quality of content on your website. In addition, it gives you actionable strategies to improve your content structure, story-telling, and cliffhangers to keep people hooked and make them scroll more rather than bounce back.
You might think everything is going well if you see your website traffic growth during the process. However, how much time do you spend analyzing the quality of that traffic? Quality is more important than quantity in almost all aspects of digital marketing.
So the scroll depth is one of the UX research process components that help identify whether the content is good enough. Moreover, compared to the time spent on the page, scroll depth is arguably a more revealing metric to analyze how much of a page is viewed.
Analyze scroll depths and mouse movements separately
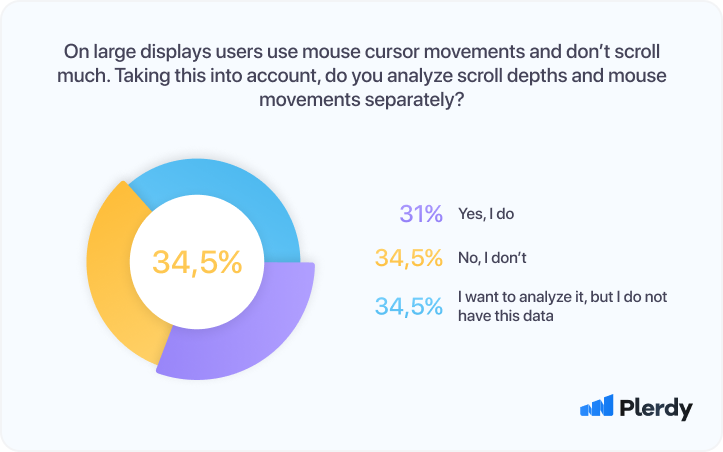
31% of respondents stated that they are analyzing scroll depths and mouse movements separately in the process, and another 34,5% want to do it as well but don’t have this data
As we see from the survey, this is one of the things many UX specialists are still not doing during their UX research process, but they understand the need and usefulness of this type of analysis. Why does it matter?
The answer is simple: users use mouse cursor movements on large displays and don’t scroll much. On the other hand, users who browse from small displays might not move that much with their mouse, but their scroll depth tends to be bigger. Similarly, consider those differences for the analysis as you optimize the design to different screen sizes.
Analyze the behavior of the logged-in users and the new users’ group separately
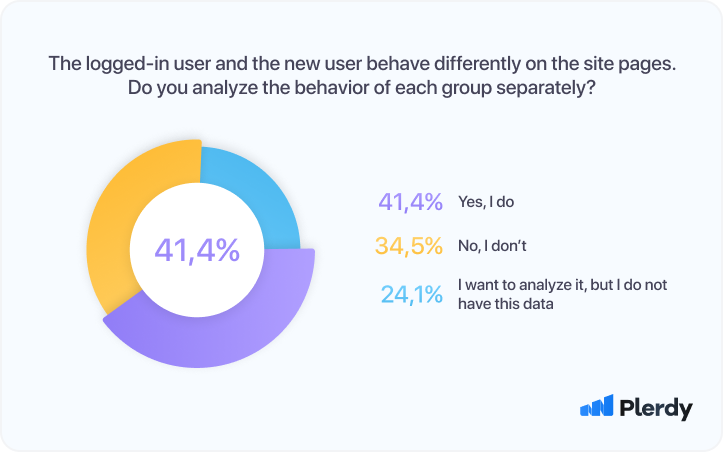
41,4% of respondents stated that they are analyzing scroll depths and mouse movements separately in the process, and another 24,1% want to do it as well but don’t have this data
Not every website has a sign-in option; in such cases, all users will be treated as non-logged, which is okay. However, if your users are required to create the account (e.g., in SaaS, e-commerce industries), then you should track and analyze them separately from the new users who have just landed on the site.
It is obvious that the logged-in users already have some experience with your product; they have other “tasks” and goals. While the new users see your site for the first time and are just learning who you are.
Both segments are equally important but in different senses:
- Analyze the logged-in users to see how to improve the experience of your current customers and increase their loyalty and love for your product;
- Analyze new users to understand if they find the needed info on your site, what’s their journey to the conversion and how to make it more convenient for them.
Analyze the sequence of clicks on the single web pages that include dynamic elements like sliders, pop-ups, tabs, etc
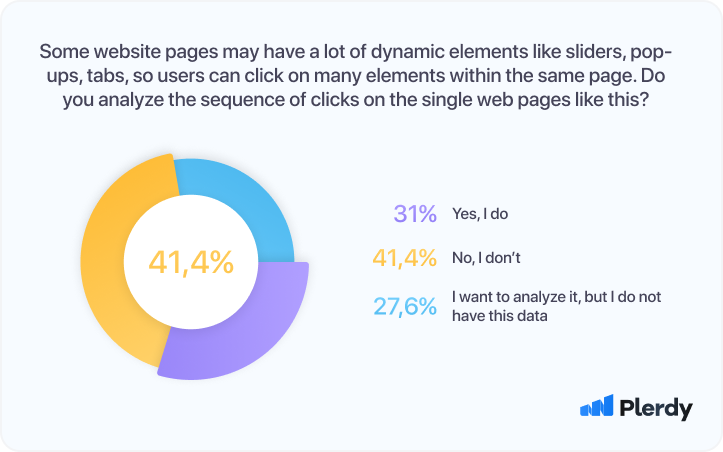
31% of respondents stated that they are analyzing the sequence of clicks on single web pages that include dynamic elements like sliders, pop-ups, tabs, etc., and another 27,6% want to do it as well but don’t have this data
Some website pages may have a lot of dynamic elements like sliders, pop-ups, and tabs so that users can click on many elements within the same page. We have touched on the dynamic elements in one of the previous questions.
Taking it further, UX specialists should analyze the clicks on those dynamic elements during the UX research process and include them in the sequence of clicks analysis.
By analyzing the sequence of clicks, you are getting into the users’ heads and understanding their thinking and decision-making process. Imagine you have some pop-ups, rotating case studies, or testimonials that are not tracked, and you don’t see them in the sequence of clicks. The user journey becomes incomplete, and the missing parts don’t allow us to make good decisions about the UX/UI.
DON’T analyze click data on empty website areas
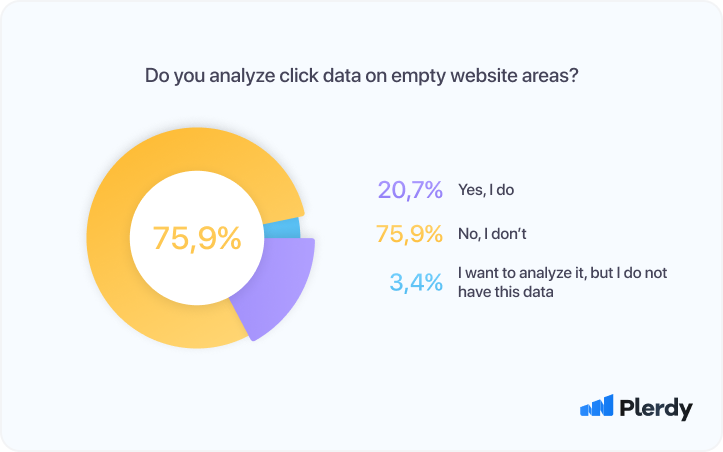
75,9% of respondents stated that they are not analyzing clicks on the empty website areas
Clicks on empty spaces do not give useful information or insights during the UX research process for one simple reason – nothing is to be analyzed. What kind of hypothesis can be built based on the clicks on an area with no elements? In 99,9%, we won’t be able to make any consequences out of it.
Instead of analyzing clicks on empty areas during UX research, consider analyzing the rage clicks, which could be a user error or a sign of poor user experience. Rage clicks provide a much better understanding of frustrating things for the users.
Use session recordings in addition to heatmaps
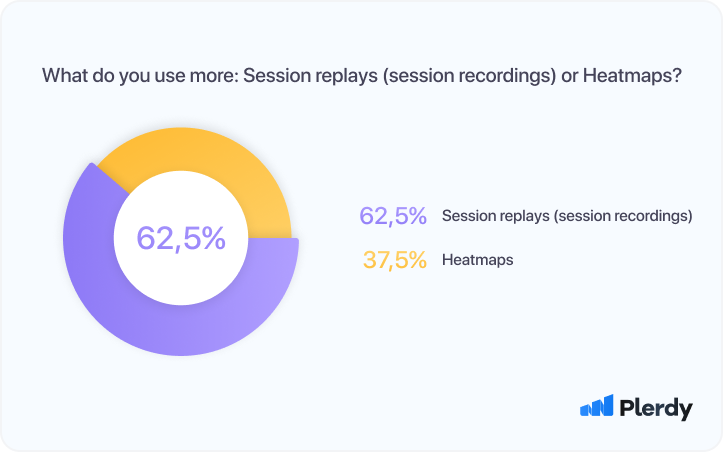
58,6% of respondents stated that they are using session replays more often than heat maps
Heat maps and session recordings in UX research allow you to analyze web visitor behavior on specific web pages and provide information about the clicks, hovers, scrolls, and mouse movements. However, the difference is in the representation of this data. In addition, session recordings are more time-consuming because you need to watch individual sessions, while the heat maps give you a more aggregated view of the user interactions.
The answer to the question of which tool to use hides in your task. What are you trying to achieve and understand?
We would recommend doing a combo and using both instruments 🙂
How to get started with heat maps
Heat maps are a must-have for every UX specialist in UX research, and our research only proved this. However, if you are not yet familiar with heat maps software – we have good news!
It is super simple to set up the heat map for your site, and with most heat maps providers, the installation process requires only adding a short code snippet to your site. The analysis part is a bit more challenging and time-consuming, but you can pick it up with good learning materials pretty quickly.
Suppose you already use heat maps in your user research – good job! Make sure you are analyzing all of the important things and metrics we mentioned in this report. Things you luck might be critical, so consider checking a comprehensive solution that will give you all the user data needed for perfect UX/UI research.
UX specialists who took part in this survey
Many thanks to 29 experienced and knowledgeable UX professionals who kindly agreed to participate in this survey and shared valuable information about how they use heat maps for user research.
Among the respondents are: Emily Drumm (DonorDrive), Tan Kai Siang (Netizen Experience), Eduardo Aguayo (3DIAS), Andrea (Staple and Spindle), Fabrice Simonnet (UBS), Pavel Kroupa (Pavel Kroupa), Toru Kasahara (Human Interface Inc.), Hasan Kadenić (SmartBug Media / Independent Contractor), Jose Thomas (Crazydes UX UI Design Studio), Charitha Surenaka (Unicorn Solutions (Pvt.)Ltd), Federico, Susana Heredia Sánchez (Biko), Jarno Ojala (Vincit), Joran van der Meer(Competa IT), Gizem Ünaler (Picus Security), A G DIMORAGKAS, Shalaka Kurup (Rated People), Megan Carlin (Share Now), Lark Aakarshan (Fragmant), Dian Wessels (Shypple), Dominic Whittington (Semetrical), Sam Beet (Rockar Tech), Annie Wilson (Blackbullion), Boris Gersic (Codex Office Solutions), Beatriz Pereira (WalliD), Martin Berlemont (Truffaut), Agnieszka Zygmunt (10Clouds), David South (Mediabarn Inc.)
Other UX research methods
As Mark Twain once said: “Supposing is good, but finding out is better.” That’s why you can’t ignore UX research when building new products and services and improving the experience of your customers. Different UX methods take the guesswork out and give a concrete understanding of what their end users want.
While in our study and survey we went more narrow and focused on user research based on the heatmaps and other software for user behavior tracking, there are also many other UX research methods that we cannot ignore.
Method Differences
Quantitative VS Qualitative
Only a few different letters in those two words but completely incomparable meanings in terms of methods and approaches. This is the first choice one should make when selecting the UX research method – whether you want to rely on numbers or words.
Some UX research methods give a measurable result, for example, collected by an analytics system or calculated based on the results of a survey number of people who did a certain action. We call such studies quantitative. The approach we had to our study was also quantitive.
On the other hand, we have a qualitative assessment consisting of the researcher or participant (in UX, it can be, for example, judgments about whether a website is convenient – inconvenient, simple – confusing, etc.).
When you have to choose the UX research method, first ask yourself how big the sample is on which you might be able to run a test. In the case of UX testing on big websites, where you have a lot of traffic and visitors, the quantitive methods work perfectly fine. This is because you have statistically enough data to make decisions based on numbers.
It is better to choose qualitative methods for tests that don’t have a big sample because the results of quantitive tests on small samples don’t make much sense due to the very big variations. Qualitative tests may seem harder to conduct and analyze the results afterward; however, their big advantage is that you can get to the point faster and understand the “why” behind certain facts and user behaviors.
The last but not the least in the user testing method selection is the goal. What are you trying to achieve and understand with this test? Answering this question gives the best hint to the correct method type.
Behavioral VS Relational
In contrast to quantitative and qualitative research, behavioral and relational methods are often thought to be very similar, even identical things. However, the truth is results of those tests do not always coincide and provide answers from different perspectives.
Behavioral methods in research answer the question “What do users do?” relational methods answer the question “What do users think?”.
It means that relational methods show the user’s feelings toward an experience. For example, how does the user like the color of the “Sign up” bottom, do they understand what this banner is for, etc.?
In contrast, behavioral research shows what the user does – where he clicked, what he ordered, what article he read, etc.
Drawing another parallel to the quantitative VS qualitative methods, behavioral research is the key to “What” questions, and relational gives you the “Why” behind the user behavior.
Product involvement
According to the degree of participation of the product in the research, methods are distinguished:
- with the natural use of the product
- using the product according to a pre-created scenario
- without product
- mixed, consisting of combinations of the above methods
Research stages
Discovery Stage
- Field study
- The study of “diaries”
- User interview
- Interviews with stakeholders
Explore stage
- Competitive analysis
- Review design
- Method of persons
- Task analysis
- Construction of the CJM
- Evaluation and testing of the prototype
- User stories
- Map sorting
Stage Test
- Quality usability testing
- Benchmarking
- Accessibility assessment
Stage Listen
- Polls
- Analytics, review
- Search-log analysis
- Bug review
- FAQ review
As you see, there are many methods and ideas on what and how to test. If you don’t know where to start or what to focus on, go back to the methods differences and try to understand the goals of your tests and the sample you have. However, note that data obtained from the research is only the first step. After you collect the data, another exciting task is waiting for you – analyzing the information, building a hypothesis and making improvements.
Conclusion
UX research is a continuous process aimed at finding insights that help make decisions about improving the user experience at different stages of their journey. Research is needed to reduce risks and, for example, not to spend resources on features that will not be used.
By regularly working with the insights collected on your site and running different UX research, tests, you can significantly improve the usability of your website. If you need help with your UX research, contact specialists from the Plerdy team who can help you with the right method selection and will arm you with the tools needed to get the UX improvement process for your site started.
FAQ
What is UX Research?
The research of user issues, requirements, and experiences is known as UX research (people). There are several research formats and techniques, but the basic objective is to uncover concepts that UX designers may employ to provide a more rewarding or joyful user experience.
What is user empathy in the UX research process?
Examining issues and experiences from users’ perspectives is known as user empathy. This requires moving beyond the scope of personal experience for UX research. Because UX designers must make choices that are both representative of and helpful to the users they are designing for, user empathy is crucial.
What is the key in UX research?
Free of preconceived beliefs (as far as possible), an open research mentality is key to successful user research. Powerful empathetic insights are lost if researchers and designers conduct (or interpret) research to support previous findings.
What is empathy in design thinking?
Iterating and problem-solving techniques known as design thinking enable designers to communicate with users more effectively. Empathy is the first step in the design thinking process. This means that users’ concerns should be studied and understood during research by designers directly in the context in which they arise.
What is a heat map in the UX research process?
A heat map is a tool for displaying and recording information about a specific user type during the UX research process. There are many other layouts for empathy maps, but the common format centers the user’s information in the middle of four quadrants: Says, Does, Thinks, and Feels.
Why use heat maps in the UX research process?
With heatmaps you can:
- Track visitors’ clicks and discover their expectations while browsing the site. Thanks to this, you can make the resource pages more attractive to users.
- Find out what people are most interested in. You will know what information they are looking for.
- Analyze scrolling behavior. You will see how many visitors have reached the bottom area of the site and how many left immediately without viewing the sections.
- Track cursor movement and determine which pieces of content people most hover over (or highlight).
What is the usability of the site in UX research?
A site’s usability is its degree of user-friendliness, which includes good design, easy navigation, a clear interface, high-quality images relevant to the topic, fast loading, and other parameters. High usability attracts potential users, allows them to solve the necessary tasks quickly, and encourages them to return to the site again.
How to evaluate usability during the UX research process?
To evaluate the site’s usability during research, they analyze behavioral factors in analytics systems, use special plugins, attract assessors and conduct surveys of resource users. In addition, there are platforms dedicated to usability auditing, such as AskUsers.
Why is usability important in UX research?
The main goal of a commercial site is to make a profit; for this, the site must be convenient and understandable. If users have problems or questions when searching for products, adding products to their shopping cart, or checking out, they will leave the site and purchase from a competitor with a better resource. Therefore, during research, it is necessary to identify and correct shortcomings in the web project’s interface, design, navigation, and logic in time. Some companies can do the process of researching for you. For instance, Plerdy specialists know everything about the UX research process and how to make your site user-friendly.