If your site gets traffic but not enough orders or inquiries, the problem is usually on the page: people don’t see the CTA, they get distracted, they tap the wrong thing on mobile, or they lose confidence before checkout

Regardless of size or industry, every business deserves access to the best technology to grow and thrive.
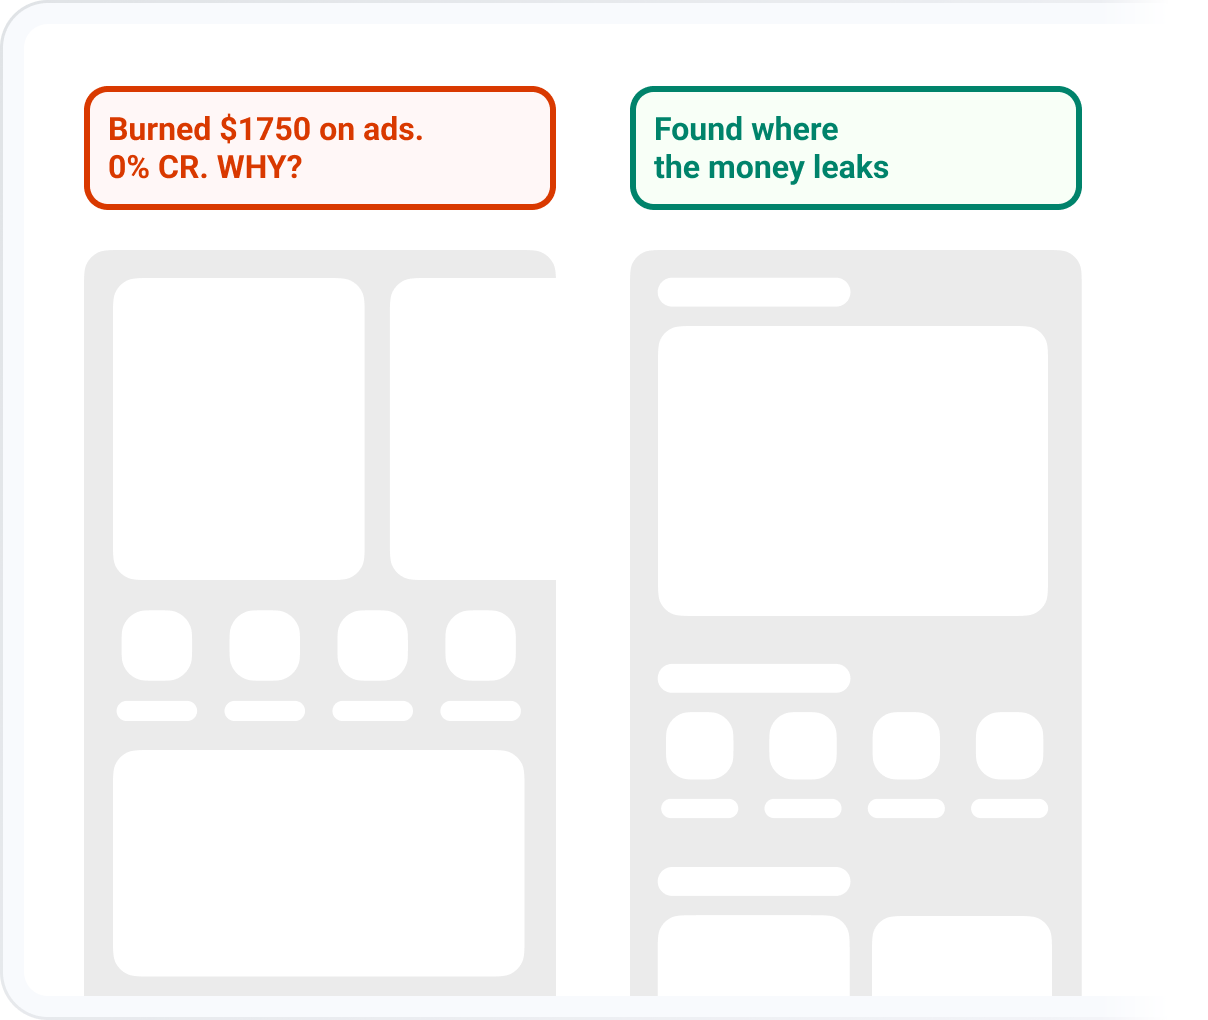
You spend thousands on Google Ads, Facebook, and SEO. You get clicks. But the sales don't match the spend. Why?
Which CTAs people don’t see (because they don’t scroll that far)
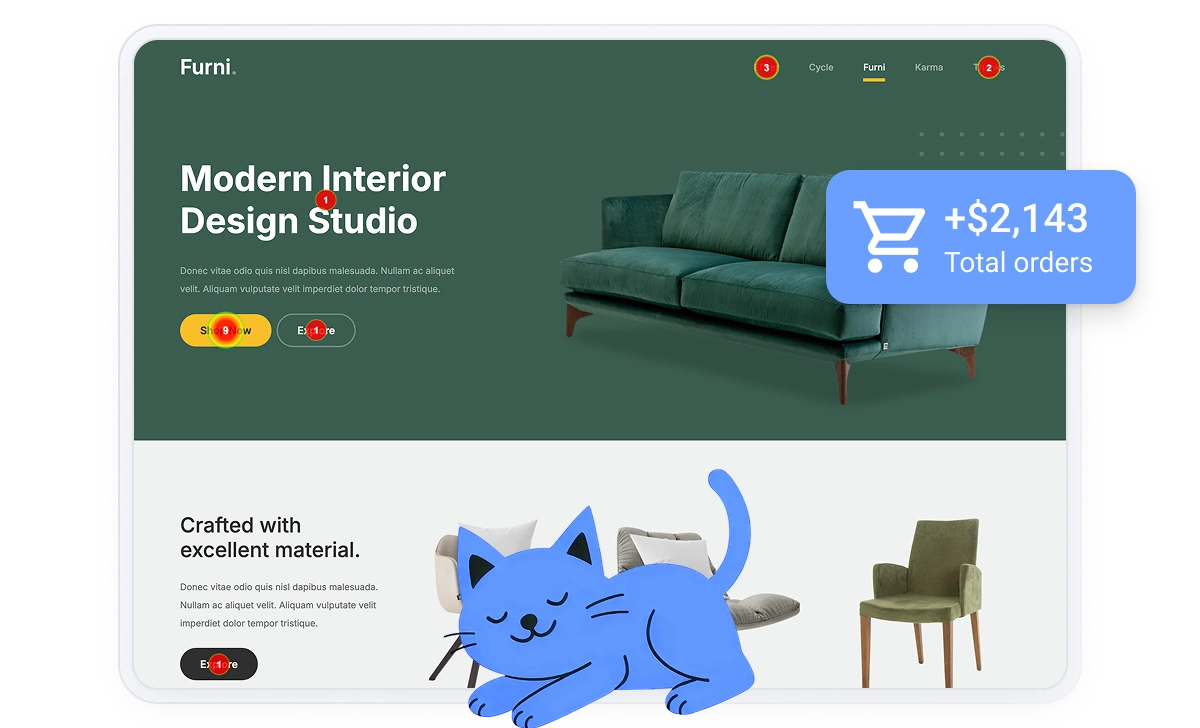
Which elements people try to click (but can’t) — a major conversion killer
Where mobile users mis-tap or hesitate before buying/contacting you
This is built for business owners with a website or online store who want clearer answers, fast:
Every minute you wait is another potential customer clicking away in frustration. Plerdy shows you the leak in minutes.
Install Plerdy on your site
Open any page (homepage, product page, landing page, checkout)
See clicks, scroll depth, and interaction patterns
Make improvements and track changes over time
Meet your new best friend: Plerdy’s Website Heatmap Tool. This isn’t just another analytics tool that spits out boring numbers. It’s a visual heatmap tool that helps you understand your website in a whole new way.
See what gets clicked — and what gets ignored
People ignore “Add to Cart” but click the product image → move CTA closer and make it more obvious
Find what people never reach
Most users don’t reach pricing/CTA/shipping info → move key blocks higher
Identify attention zones and hesitation
Users hover around shipping/returns → add reassurance + CTA right there
Understand the first action and user journey
First clicks go to menu/logo → simplify hero and make the next step clear
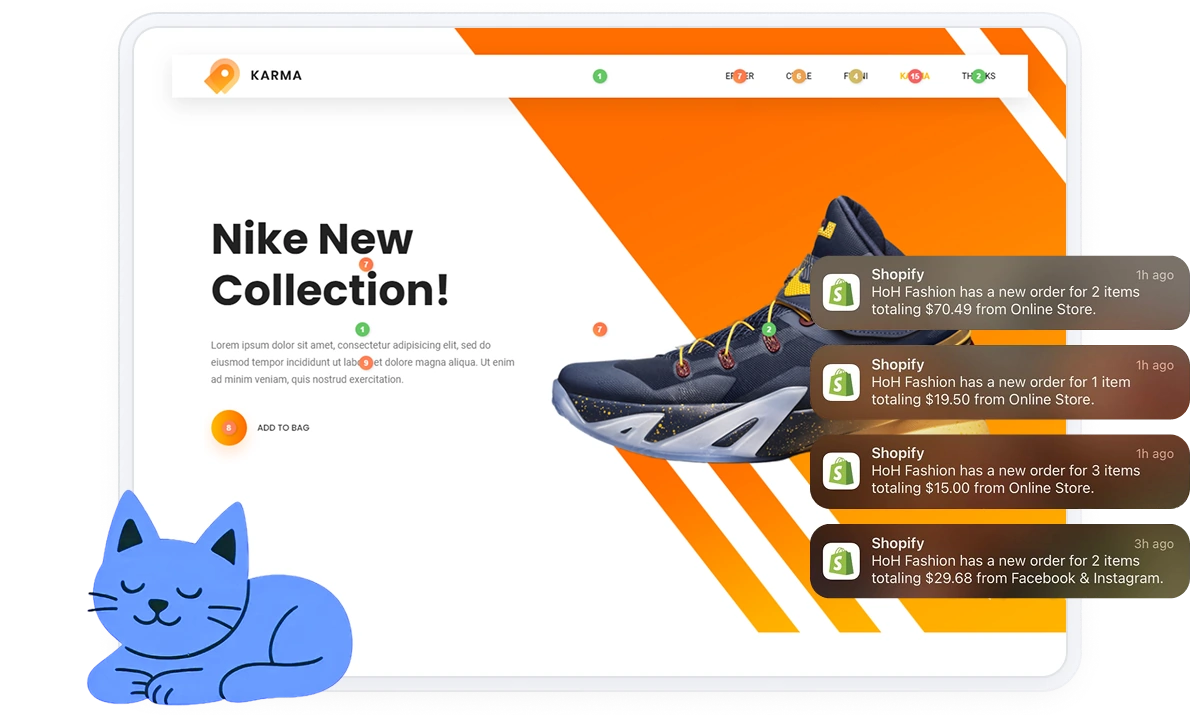
Track pop-ups, menus, sliders, dropdowns
A mobile slider gets ignored/blocks clicks → replace with a simpler layout
Compare behavior by device/country
Mobile behaves differently → optimize layout and CTA placement for mobile
See what happens right before purchase/submit
Users check “Shipping” repeatedly before checkout → show shipping earlier
Compare paid vs organic vs social behavior
Paid traffic bounces faster → align landing page message with the ad
Separate new vs returning users
New visitors hesitate → add trust signals above the fold
Heatmaps are valuable because they help you:
Discover why customers love Plerdy's comprehensive and intuitive web optimization tools, as acclaimed on G2.com


The heatmap and user interaction data. Being able to clarify what elements or sections of your website your customers are using or not using. To then have the power from the data provided to make further adjustments if you wish to.

Joseph D.
With Plerdy you get to see information you don't see with other tools or stats. For example, thanks to Plerdy click heatmaps, we found out that visitors omitted our most important navigation entries (possibly that they looked too much like headings).

Martin B.
The heatmap is the most useful feature of Plerdy. It lets us have a bird's eye view of what keeps our website visitors. We love sharing information with our visitors and clients, and Plerdy helps us have a better idea of what we can or should do next.

Joshua L.
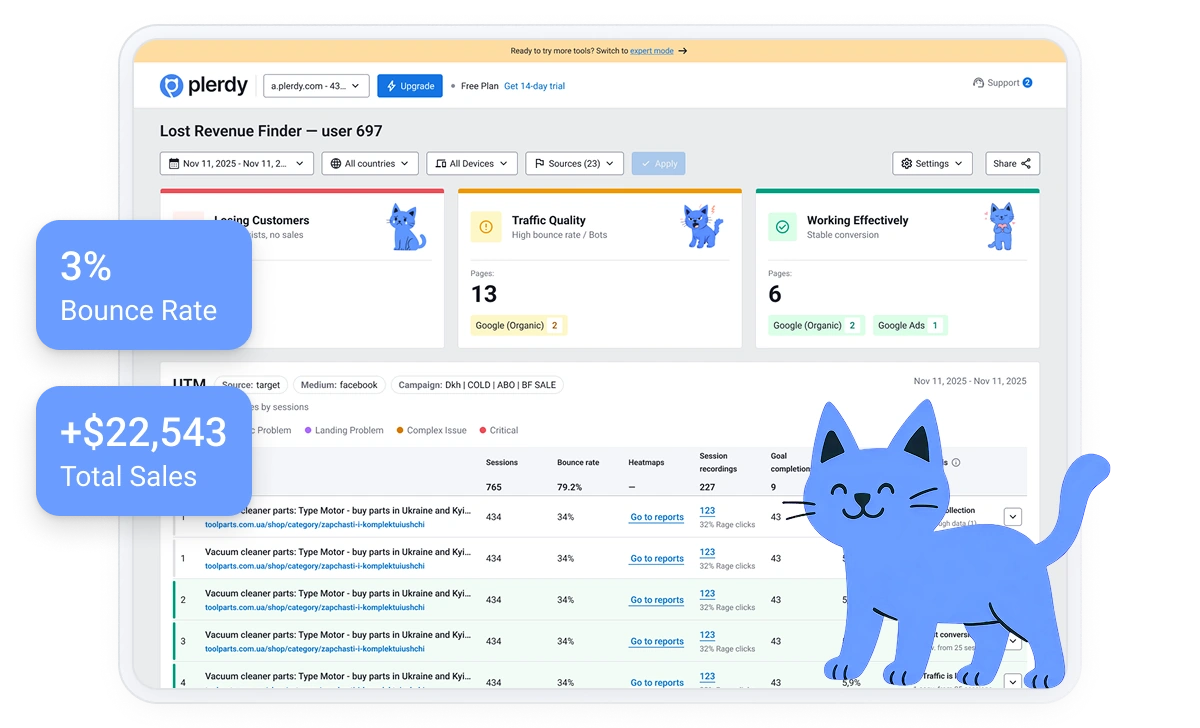
A website heatmap is a visual report that shows where visitors click, how far they scroll, and which areas get the most attention — directly on your pages.
Google Analytics shows what happened (numbers). Heatmaps show why it happened by visualizing behavior on the page (missed CTAs, confusing elements, mobile issues).
Yes. Heatmaps are especially useful for category pages, product pages, cart, and checkout to reduce friction and improve conversion rate.
Yes. You can compare mobile vs desktop behavior and fix tap issues, layout problems, and CTA visibility.
On high-traffic pages, you’ll often see clear patterns quickly. More sessions = clearer decisions, but you don’t need weeks to spot obvious blockers.
Yes. You can review behavior by device, location, traffic source, and user groups to understand how different audiences behave.
Start with the pages tied to revenue: product pages, cart/checkout, and your main landing pages. Fix visibility (scroll depth) and engagement (clicks) first.
316+ G2 reviews
Content for UX designers, SEO specialists, and business owners