
Jun 12, 2026
If you're not measuring UX, you're probably paying for traffic that doesn't convert — and you won't even see where the money leaks. These UX statistics (based on Plerdy data from thousands of websites) show the real patterns behind clicks, scroll depth, bounces, and "no-action" sessions, so you can stop burning budget and fix the exact page sections that block purchases and leads. Scroll down and compare the numbers with your own site behavior — the gaps you'll spot usually point to the fastest revenue wins.
We can see that the correlation between mobile and desktop clicks varies depending on the day. On weekends, people are more likely to browse on mobile devices. They also rarely use tablets in general. You must also track where visitors click. If some items don't get interactions, the usability (UX) may be bad, so you need to enhance the user experience.
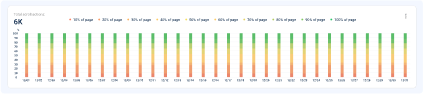
The scroll statistics imply that a large share of users doesn't reach the bottom of the page. Thus, if you place critical UX elements too far, no one will see them. So gather the scroll data to offer an optimum user experience and place important buttons, CTA, or menus within reach.
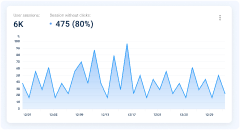
Around half of user sessions happen without clicks. It means a person visits the page, sees its content, and goes away. The reasons usually vary, so you need a user experience (UX) analysis. Your website may lack important information, have unconvincing calls to action, or offer a bad user experience.
One-page sessions, when users make many interactions on the first page and then leave, are a classic example of a bounce. If your bounce rate is high, users may be unable to find the necessary conversion element, or their user experience may be confusing for any other reason.
Around a quarter of visitors don't scroll website pages at all. It can signify that they are non-targeted traffic or you have user experience issues. I recommend combining this report with additional UX data to detect the reasons behind such behavior.
Very few visitors reach page footers. What does it tell us about user experience? Locate essential design elements like the Check Price button, reviews, or certification badges closer to the top. Also, consider shortening the page length altogether.
This report reflects how actively people navigate your website. Note that a potential customer may use a 1920px screen resolution monitor. Then, the first screen will contain many elements therefore, such analytics won't show the real picture. Thus, you should use this report as a supplement to other UX reports.
Leads that navigate only one part of the page pay no attention to content in other sections. This statistical data helps evaluate desktop website versions. It won't provide you with accurate data on mobile users since they don't use a mouse.
The mouse cursor rarely reaches the last website section. So you must consider this user experience specifics while optimizing your website. Don't put life-critical information too low.
Most users come from organic search, followed by direct, UTM, and Google Ads. This data allows you to evaluate user activity, taking into account traffic sources, and plan your marketing campaigns accordingly. You may also focus your UX optimization effort on the needs of the primary target audience.
Content for UX designers, SEO specialists, and business owners