Website Heatmap Tool

Want to know what your website visitors actually do on your pages — not just what you think they do? Meet your new best friend: Plerdy’s Website Heatmap Tool.

  • capterra 4.9/5
  • growd 4.7/5
  • 280+G2
  • gdpr

Features Breakdown: How Plerdy’s Heatmap Works

Meet your new best friend: Plerdy’s Website Heatmap Tool. This isn’t just another analytics tool that spits out boring numbers. It’s a visual heatmap tool that helps you understand your website in a whole new way.

  • Click Map

    A visual heatmap that shows which buttons, links, or sections users interact with

    Real-World Use Case

    An eCom brand moved their “Add to Cart” button 120px higher. Boom — +18% conversions.

  • Scroll Map

    Heatmap tool reveals how far users scroll down your web pages

    Real-World Use Case

    A SaaS company learned 55% of users missed the CTA. Moved it higher. Conversions? 2.5x up.

  • Mouse Movement Map

    Tracks hover patterns and user attention zones

    Real-World Use Case

    A blog noticed cursor movement near static text. Turned it into a CTA — 600+ new leads.

  • Click Path & First Click Tracking

    Tracks what users click first and the full sequence

    Real-World Use Case

    A landing page had users clicking a logo first. Layout changed. Result — bounce rate dropped 19%.

  • Dynamic Element Tracking

    Records interaction with pop-ups, menus, sliders, and other interactive elements

    Real-World Use Case

    A fashion brand’s mobile slider was underperforming — fixed it thanks to heatmap data. Revenue up 33%.

  • Location & Device Segmentation

    Shows click data based on device type and country of the user

    Real-World Use Case

    An online store saw high mobile traffic from Germany — localized and optimized mobile UX. Conversions +29%.

  • Macro & eCommerce Conversion

    Reveals what users clicked right before submitting a form or completing a purchase

    Real-World Use Case

    A clothing brand tracked pre-checkout clicks, optimized steps, and dropped cart abandonment by 35%.

  • Traffic Channel Heatmap

    Compare user behavior from organic, paid, social, and direct channels

    Real-World Use Case

    Facebook users skipped nav bar. Organic traffic didn’t. Layout personalized by source — higher retention.

  • User Group Segmentation

    Filter heatmap data by user type: new, returning, registered, guest, etc.

    Real-World Use Case

    A course platform segmented users and learned that first-timers needed clearer CTAs. Adjusted and got +24% form submissions.

What Users Say About Plerdy’s Website Heatmap Tool

Discover why customers love Plerdy's comprehensive and intuitive web optimization tools, as acclaimed on G2.com

"Great tool to help visualise important data"

The heatmap and user interaction data. Being able to clarify what elements or sections of your website your customers are using or not using. To then have the power from the data provided to make further adjustments if you wish to.

Joseph D.

Joseph D.

Business Support Officer

Read on G2.com
"Information you miss with all other tools"

With Plerdy you get to see information you don't see with other tools or stats. For example, thanks to Plerdy click heatmaps, we found out that visitors omitted our most important navigation entries (possibly that they looked too much like headings).

Martin B.

Martin B.

CTO

Read on G2.com
"A very useful tool for business websites"

The heatmap is the most useful feature of Plerdy. It lets us have a bird's eye view of what keeps our website visitors. We love sharing information with our visitors and clients, and Plerdy helps us have a better idea of what we can or should do next.

Joshua L.

Joshua L.

Director

Read on G2.com

Trusted by Smart Teams Around the World

Regardless of size or industry, every business deserves access to the best technology to grow and thrive.

What’s Wrong With Most Websites

You spend hours designing a nice layout, writing smart copy, placing perfect CTAs — and still no clicks, no sales. Why? Because traditional analytics tools won’t show you what’s not working visually

Taditional analytics tools won’t show you what’s not working visually.
  • Users don’t scroll to your CTA? You won’t see that in GA, but your heatmap shows it clearly.
  • Visitors think your nav menu is just text? You’ll never know... unless you use a heatmap.
  • Mobile users rage-click the wrong button? A website heat map reveals it in seconds.
Stop guessing. Start seeing. With Plerdy’s heatmap analytics, you:
  • Get real-time visual data
  • Understand where visitors are dropping off
  • Optimize every page based on how users actually behave

Who Uses Website Heatmaps – And Why

Not just marketers. Not just analysts. Website heatmap tools are for everyone serious about growth. Who’s benefiting:

page image cat grafik
  • UX & UI Designers → Build user flows based on actual heatmap data.
  • Digital Marketers 
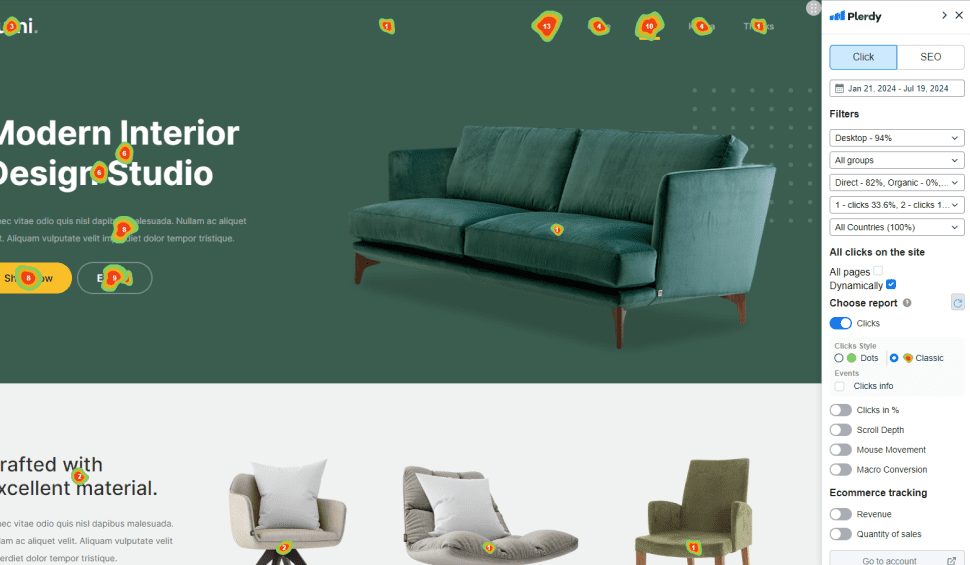
→ Use heatmaps to A/B test layouts, CTAs, and improve website conversions.
  • eCommerce Owners → Optimize product pages based on click maps. Know which items get ignored.
  • SEO Specialists 
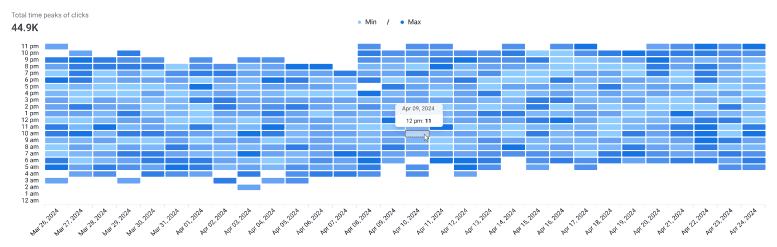
→ Pair website heatmap insights with bounce and dwell time metrics.
  • Founders & CEOs → Understand your website’s blind spots and build data-backed strategies.
In 2025, if your website toolset doesn’t include a heatmap, you're leaving clicks (and cash) on the table. Top brands like Canva, Shopify, Neil Patel, and Wix rely on heatmap platforms to create addictive user experiences. If it works for them, you know it’s not hype.

Numbers That Prove Website Heatmaps Work

See how heatmaps improve UX, raise conversions, and reveal user behavior — backed by real stats.

70%

Users never scroll below the second fold (source: Nielsen).

+210%

A single CTA move increased the conversion rate by this much (Plerdy case study).

Billions

Plerdy heatmaps track this many website clicks every month.

−18%

Bounce rate dropped by this much after heatmap analysis.

+22%

Session time increased by this amount after scroll optimization on an online course site.

300+ G2 reviews

Let’s Wrap It Up – Why This Heatmap Tool Rocks

If you’re serious about your website’s performance, don’t waste another day guessing. Plerdy’s heatmap tool gives you:

  • 100% visual clarity on what works and what doesn’t
  • Real-time behavior tracking for clicks, scrolls, and mouse movement
  • Actionable insights that improve UX, SEO, and conversions

$0 / Forever

  • 100* Heatmaps (daily limit)
  • 500* Video sessions
  • 5,000* SEO audit
  • 100* Pop-up
  • 100* E-commerce tracking
  • 100* Conversions
  • 2* AI UX Assistant
  • Unlimited A/B testing
  • 1 Months of storage
*You can increase the limits by upgrading the package or buying a separate limit. Try the Free Plan — No Risk

Articles from the blog

Content for UX designers, SEO specialists, and business owners