
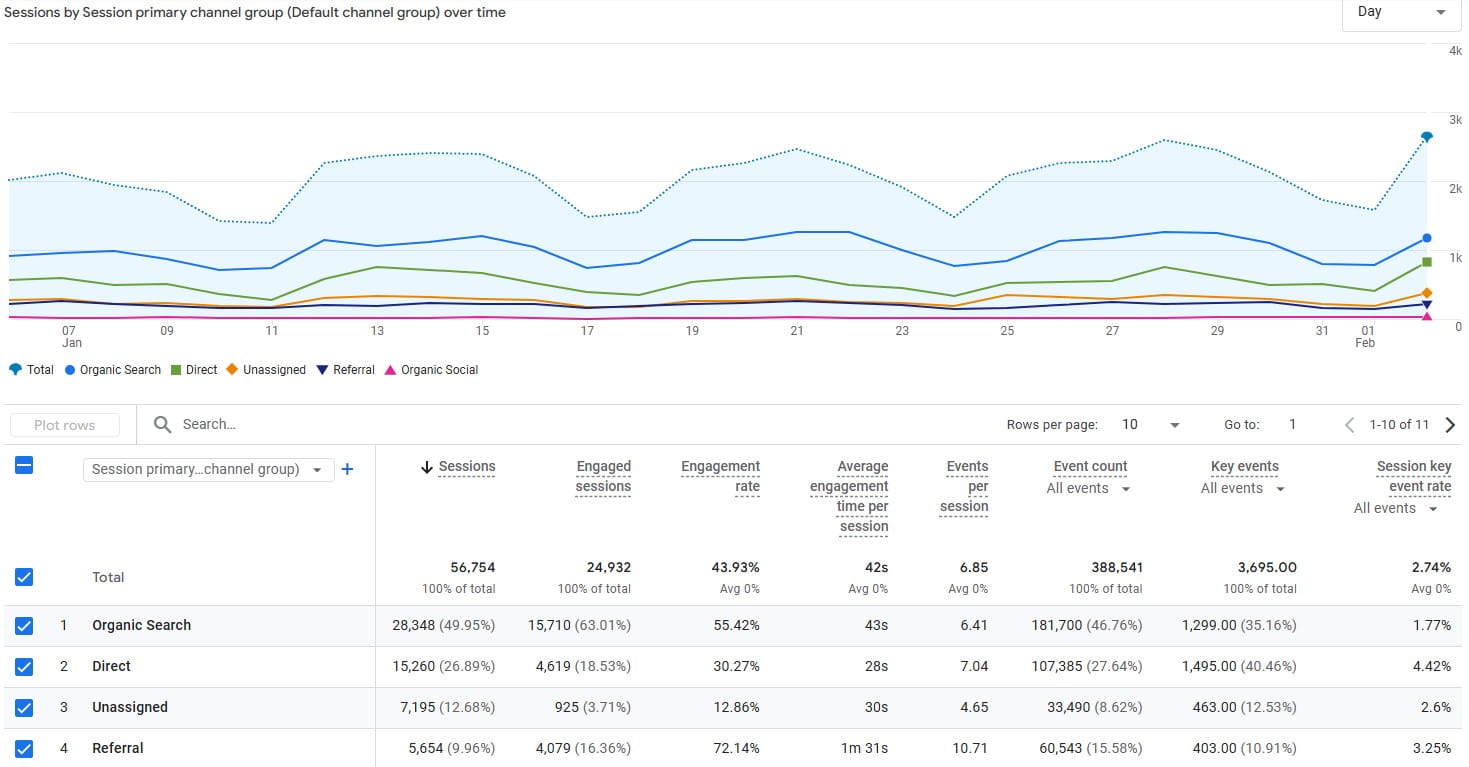
You launch a campaign. Sessions climb. Clicks keep coming. The dashboard looks busy enough to feel like progress.
Then the quiet part shows up.
No orders. No demos. No “let’s do this” replies. Just that uncomfortable moment where you realize you paid for attention, but your website didn’t turn that attention into revenue.
The weird part is how often this isn’t a “your ads are bad” situation. It’s a leak situation. And in about 60 seconds, you can usually tell which kind.
The Leak Map: Where Sales Disappear After The Click
Most websites don’t fail because the product is terrible. They fail because the path from “I’m interested” to “I’m buying” has small breaks everywhere.
Those breaks don’t look dramatic. They look like hesitation. Confusion. People scrolling like they lost the plot. Dead clicks. A back button that ends the story.
Here are the most common leak points, with the symptoms you can actually spot.
- Message Mismatch (Intent Clash): People arrive expecting one thing and get another. Symptoms: bounce rates spike, time on page is low, and visitors scroll fast like they’re hunting for the promised offer. It matters because mismatch kills trust instantly, and trust is the first conversion step you can’t skip.
- Clarity Leak (What Am I Supposed To Do Here?): The page has content, but no obvious next step. Symptoms: cursor wandering, clicks on non-clickable elements, repeated taps on headings, and “CTA blindness” where the button exists but doesn’t feel like the answer. It matters because people don’t want to solve a puzzle after clicking an ad.
- Trust Leak (Subtle Doubt Wins): Shipping costs are hidden, returns are unclear, reviews feel thin, or the site looks slightly off on mobile. Symptoms: visitors reach key sections, pause, and leave; they open policy pages and never return; they hover near payment steps and bounce. It matters because doubt is stronger than desire when money is involved.
- Friction Leak (Forms, Checkout, And Micro-Pain): Too many fields, confusing error messages, slow pages, awkward input masks, or a checkout that feels like paperwork. Symptoms: “field rage” (repeated typing, deleting, retyping), rage clicks on disabled buttons, and drop-offs right before the finish line. It matters because friction is a silent discount you force on your own conversion rate.
- Navigation Leak (The User Leaves Your Funnel): People click menus, related products, or external links because the page didn’t answer the next question. Symptoms: exits to category pages, bouncing between pages without progressing, and losing visitors to “research mode.” It matters because every extra choice is an opportunity to quit.
Why “More Traffic” Often Makes The Problem Worse
When sales are flat, the most natural reaction is: “We need more traffic.” It feels active. It feels like a lever you can pull.
But if your website is leaking, more traffic doesn’t fix the leak. It pours more money into the same cracks.
Three forces make this trap feel logical even when it’s expensive.
- Loss aversion: You already spent money to get traffic. Admitting the site is the issue feels like admitting you “wasted” the spend, so you double down and try to outspend the problem.
- Sunk-cost fallacy: You’ve invested in a theme, a redesign, a “brand refresh.” You want it to work because you paid for it, not because it’s converting.
- Optimism bias: You assume the next campaign tweak will fix it. Meanwhile, the same friction stays in place and quietly taxes every click you buy.
A 60-Second Reality Check: Find The Leak Before You Buy More Clicks
If you want to stop guessing, start by answering one question: are you buying the wrong traffic, or sending good traffic to a broken experience?
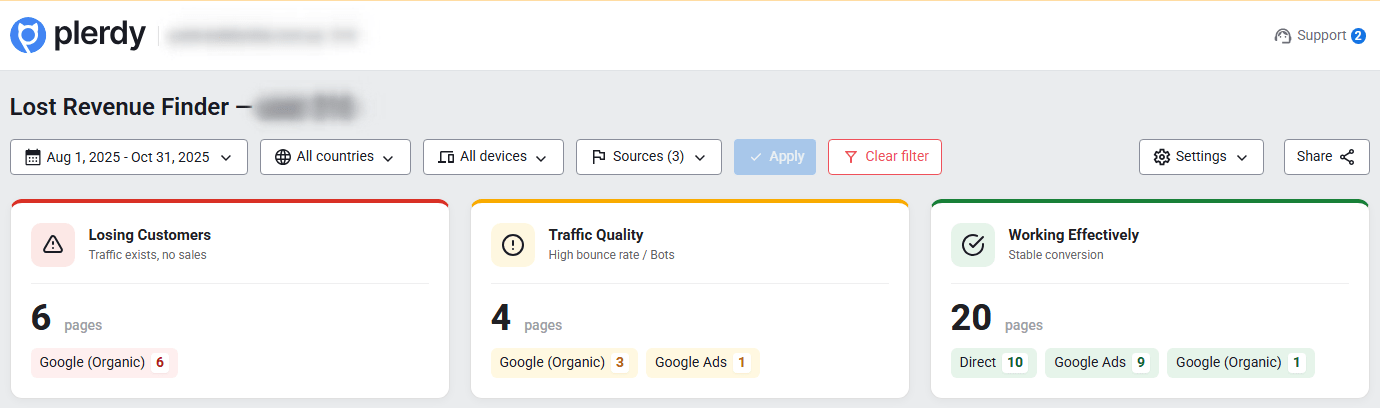
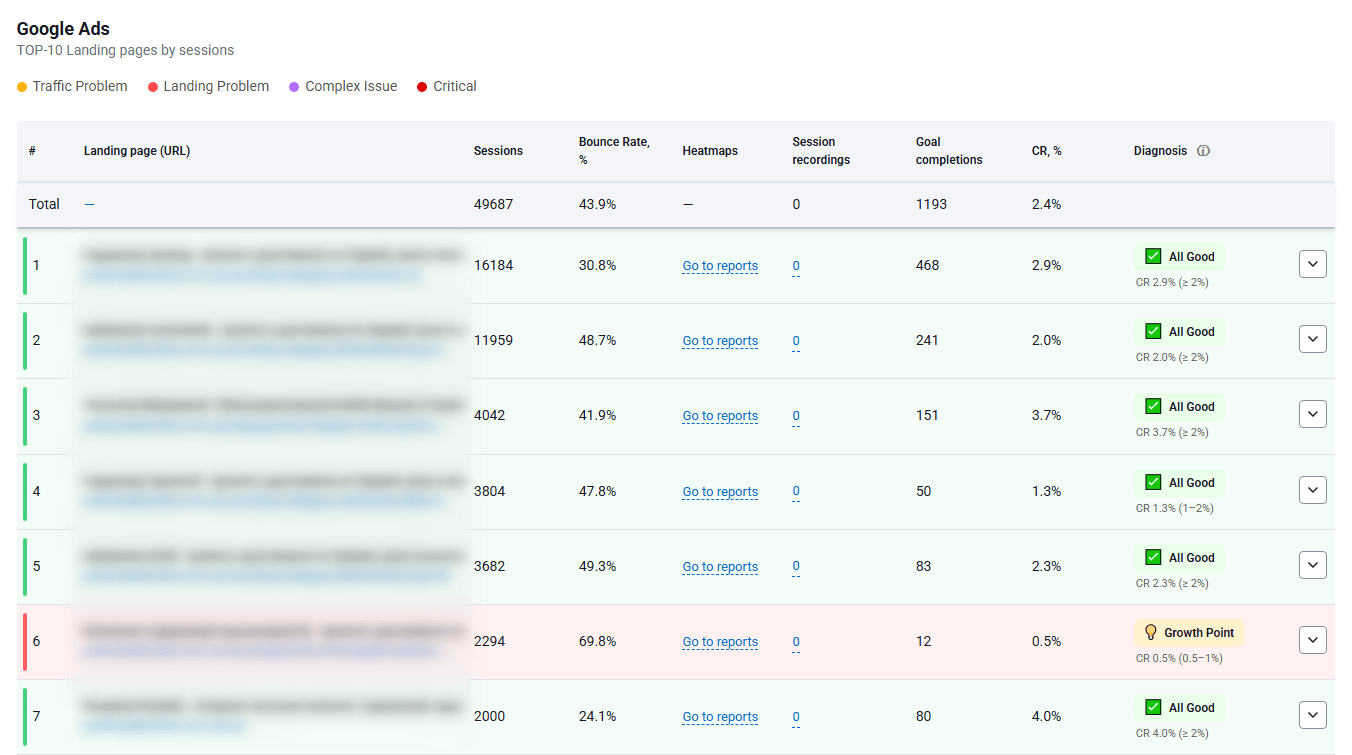
Plerdy’s Lost Revenue Report (Business Mode) is designed for that exact moment. It’s a fast, founder-friendly scan that helps you spot where money stops flowing—before you spend another week “optimizing ads” on top of a leaky funnel.
You run it, you get a map of weak points, and you can make a decision: fix targeting and messaging, or fix the page and funnel.
What The Plerdy Lost Revenue Report Shows In Business Mode
- It flags where users drop off across key paths (for example: landing page → product → cart → checkout), so you see the “break” instead of staring at averages.
- It highlights pages and steps that behave like bottlenecks, including unusually high exits, repeated back-and-forth navigation, or key pages that don’t lead anywhere meaningful.
- It helps separate two realities: traffic mismatch (people leave immediately) versus funnel friction (people try, then fail or quit later).
- It surfaces practical “leak signals” such as weak engagement on critical CTAs, confusing step transitions, or paths that look active but don’t convert.
Campaign Problem Or Landing Page Problem? Use This Decision Tree
Here’s the simple rule: if people don’t even try, you likely have a campaign problem. If people try and still don’t finish, you likely have a landing page or funnel problem.
Use this as a quick decision tree: If you see X → do Y.
If It’s A Campaign Problem
- Signal: Most visitors bounce fast, scroll shallow, and don’t interact. You see “drive-by traffic” behavior: arrive, glance, leave.
- Fix: Tighten the promise. Make your ad and landing page match on the first screen: offer, audience, and next step. Remove “nice-to-have” copy that distracts from the core message.
- Check: Compare behavior by traffic source. If one campaign sends visitors who scroll, click, and explore while another sends instant bounces, your targeting/message is the leak—not the page.
If It’s A Landing Page Or Funnel Problem
- Signal: People click, scroll, open details, maybe add to cart—then disappear at a specific step (often product page, cart, or checkout).
- Fix: Reduce friction where the drop happens. Simplify the step, clarify the next action, remove surprises (fees, shipping ambiguity), and fix broken or misleading UI.
- Check: Look for “struggle patterns”: dead clicks, repeated clicks on the same element, sudden scroll jumps, and hesitation around forms or payment steps.
Go Deeper With Expert Mode: Prove What Users Actually Do
Business Mode tells you where the leak is. Expert Mode helps you understand why it’s happening.
This is where you stop debating opinions like “the page looks fine” and start working with evidence: what people click, what they ignore, where they hesitate, and where they quit.
Heatmaps: What Gets Clicked, What Gets Ignored
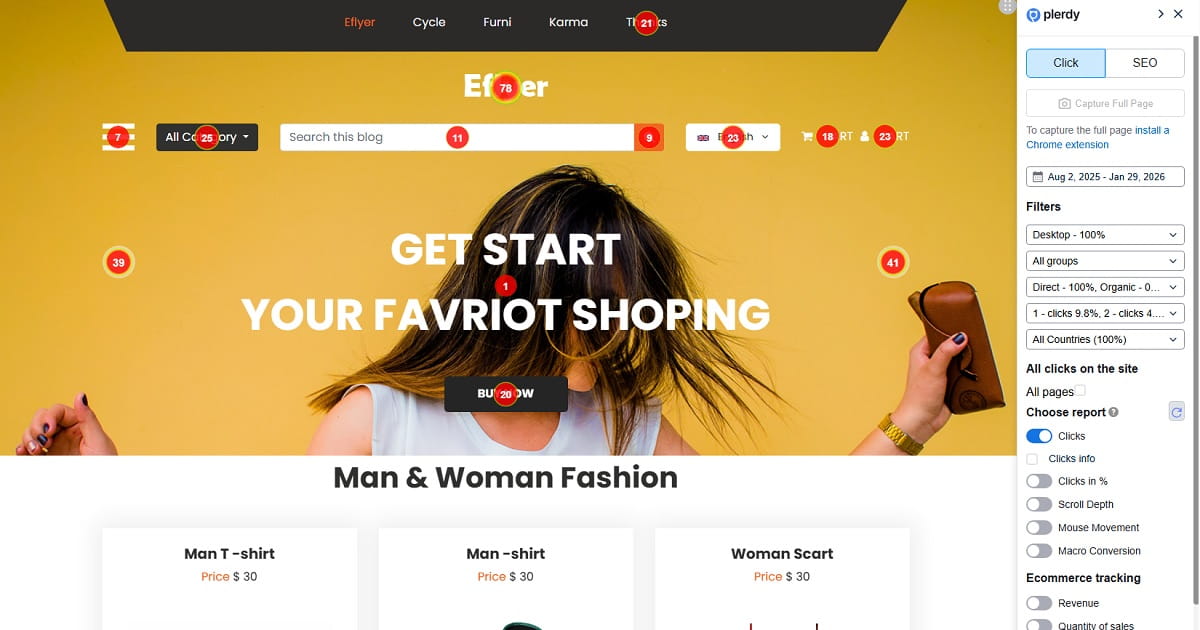
Heatmaps are your fast visual truth. They show where attention concentrates and where it doesn’t.
Practical things heatmaps can reveal in minutes:
- CTA blindness: Your main button exists, but users focus on secondary elements (images, badges, navigation) and never treat the CTA as the obvious next move.
- Dead clicks: People click things that aren’t clickable (headings, icons, product photos without a link). That’s a clarity leak: users are asking the page a question and getting silence.
- Distraction zones: A promo banner or sticky header gets heavy attention, but it pulls users away from the purchase path.
- “Hidden value”: Your strongest proof (shipping, returns, guarantees, reviews) is below the fold, but the scroll depth drops before users ever see it.
Session Recordings: Where People Hesitate, Rage-Click, Or Quit
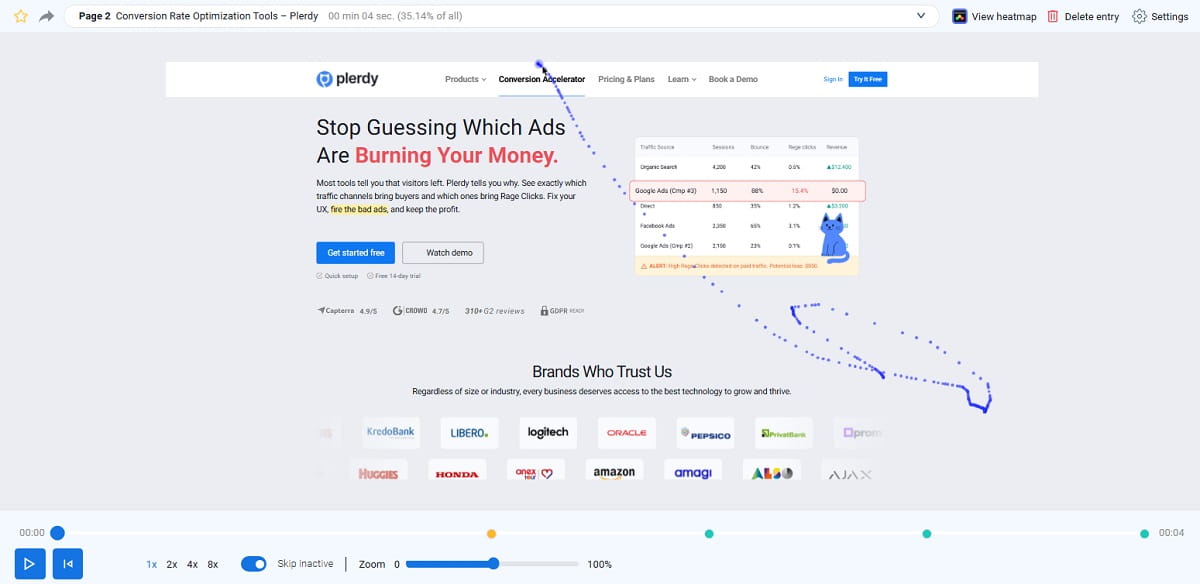
Session recordings are where you see the human moments that analytics hides.
You’ll spot patterns like:
- Hesitation loops: People re-read the same block, scroll up and down, or hover without acting. That’s usually unclear value, unclear pricing, or unclear next step.
- Rage clicks: Repeated clicks on the same element that doesn’t respond. Often caused by broken UI, slow interactions, disabled buttons, or unclear form errors.
- Scroll-drop exits: Users never reach key trust or product details because the page is heavy, long, or front-loaded with fluff.
- Field rage: Typing, deleting, retyping, getting error messages, trying again. This is pure conversion tax.
When you see these behaviors, you stop “guessing improvements” and start fixing specific friction.
The 7-Day “Stop The Bleeding” Fix Plan
If you want a plan that respects your time (and your budget), do this in seven days: quick wins first, then clarity and trust, then deeper funnel fixes, then testing.
- Day 1–2: Run the Lost Revenue Report (Business Mode), pick one primary leak to attack, and fix obvious breakpoints: broken links, missing buttons, confusing navigation, slow-loading hero sections, dead clicks on key elements, and anything that blocks the path to cart/checkout.
- Day 3–4: Rewrite the first screen for clarity: who it’s for, what you sell, why it’s different, what the next step is. Add trust where it matters: shipping clarity, returns, guarantees, reviews, payment icons, and contact visibility. Remove “mystery” from pricing and conditions.
- Day 5–6: Focus on product and checkout friction: shorten forms, reduce required fields, improve error messages, make delivery/returns visible before checkout, and remove surprises. Fix mobile UX issues (spacing, sticky overlaps, hard-to-tap elements) that create misclicks and drop-offs.
- Day 7: Pick one high-impact test: a clearer CTA, a simplified checkout step, a different layout for product proof, or a stronger first-screen offer match to your ad. Measure behavior changes (not just conversions) so you can see progress before the revenue fully catches up.
Mini Cases: What “A Leak” Looks Like In The Real World
Case 1: “Good Ads, Wrong First Screen”
A founder runs a targeted campaign to a landing page that looks beautiful—but it opens with a vague headline and a lifestyle image. Visitors arrive, scroll fast, and leave.
The Lost Revenue Report shows heavy drop-off at the landing page stage. Expert Mode confirms the story: heatmaps show attention on the image and navigation, not on the CTA. Session recordings show people searching for basic answers (“What is this?” “What do I get?”) and exiting when they don’t find them fast.
The fix is not “more traffic.” The fix is a tighter first screen: clear offer, clear audience, clear next step. After that, the same traffic stops behaving like strangers and starts behaving like buyers.
Case 2: “They Add To Cart, Then Vanish”
An ecommerce store gets steady add-to-cart behavior, but purchases lag. The team blames price, then blames shipping, then blames “the market.”
The Lost Revenue Report highlights a sharp leak between cart and checkout. Expert Mode shows why: session recordings reveal confusion around shipping costs and a form that throws errors late. Users retry fields, back out, and quit. Heatmaps show heavy clicking on shipping and return links—right before the exit.
The fix is straightforward: show delivery expectations earlier, simplify the checkout fields, and remove surprises. The leak wasn’t demand. It was friction.
Case 3: “Mobile Is Quietly Killing Conversion”
A small business site converts on desktop but struggles on mobile. Paid traffic is mostly mobile, so the economics get ugly fast.
The Lost Revenue Report flags weak progression on mobile-heavy pages. Expert Mode recordings show mis-taps, sticky elements covering buttons, and scroll fatigue. Heatmaps show attention dispersed, with users clicking irrelevant UI because the main path isn’t obvious on a small screen.
The fix is a mobile-first cleanup: larger tap targets, less clutter above the fold, and a clearer CTA sequence. Once mobile stops being a maze, the same traffic finally has a fair chance to convert.
Quick Self-Check: Are You Buying Traffic Into A Leaky Bucket?
- Do visitors land on your page and leave without clicking anything?
- Do people scroll, but fail to reach your key proof (reviews, shipping, guarantees)?
- Do you see adds to cart, but a sharp drop at checkout?
- Do users click on things that aren’t clickable (dead clicks) or repeat clicks in frustration?
- Do you keep increasing spend because “it should work,” even though the funnel hasn’t improved?
Conclusion: Stop Paying For Clicks That Never Had A Chance
You don’t need more traffic to feel better. You need fewer leaks to make your current traffic worth what you’re paying.
When you map the leak, everything becomes simpler: you stop debating opinions and start fixing specific breakpoints.
If you want a fast starting point, run the Plerdy Lost Revenue Report (Business Mode). In about a minute, it helps you see whether you’re dealing with a campaign mismatch or a funnel friction problem—so the next thing you do is the thing that actually moves revenue.
You don’t need more traffic. You need fewer leaks.