



















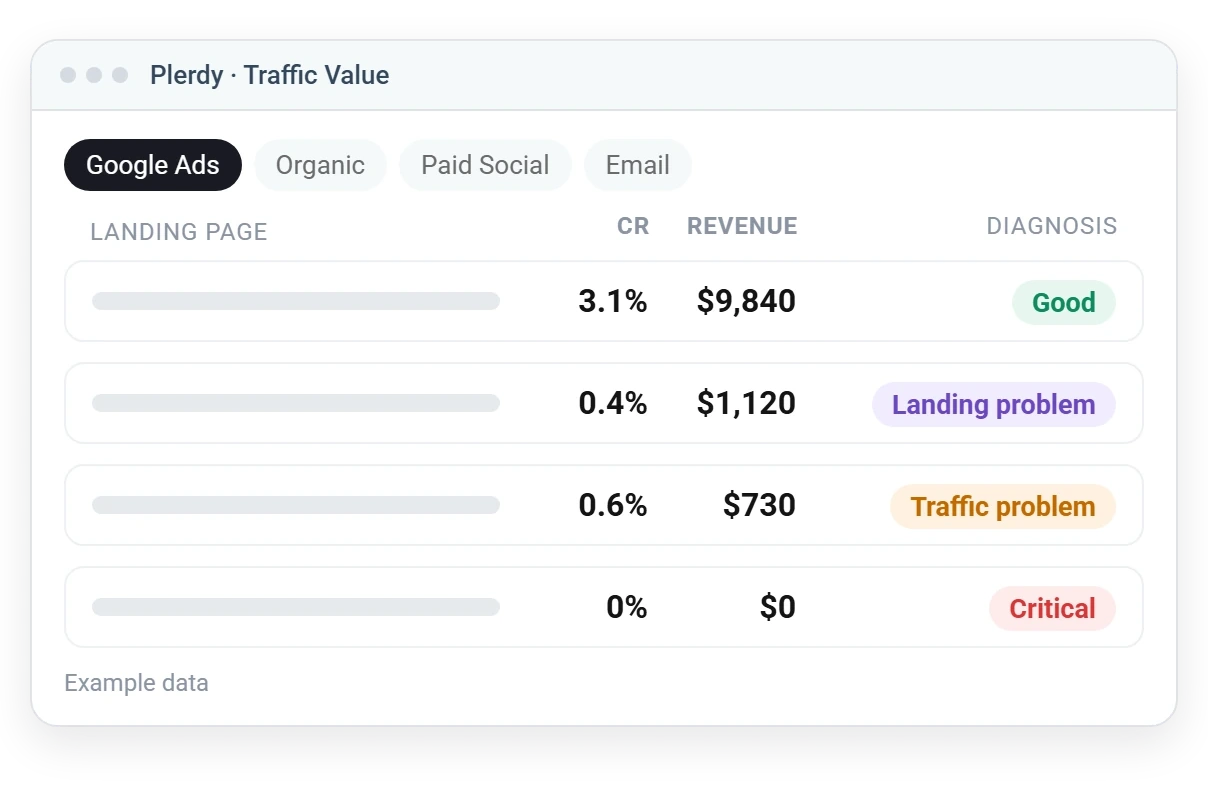
Traffic Value is a lost revenue finder: every landing page and traffic channel in one table — with sessions, conversions, revenue and a clear diagnosis. See which ads bring buyers, which pages lose them, and what to fix first.
Regardless of size or industry, every business deserves access to the best technology to grow and thrive.
You spend on Google Ads, social and SEO. Traffic Value shows which of that traffic turns into money — page by page.
Paid pages with heavy bounce and zero conversions are flagged as Critical — budget loss
See whether the problem is the traffic or the landing page itself
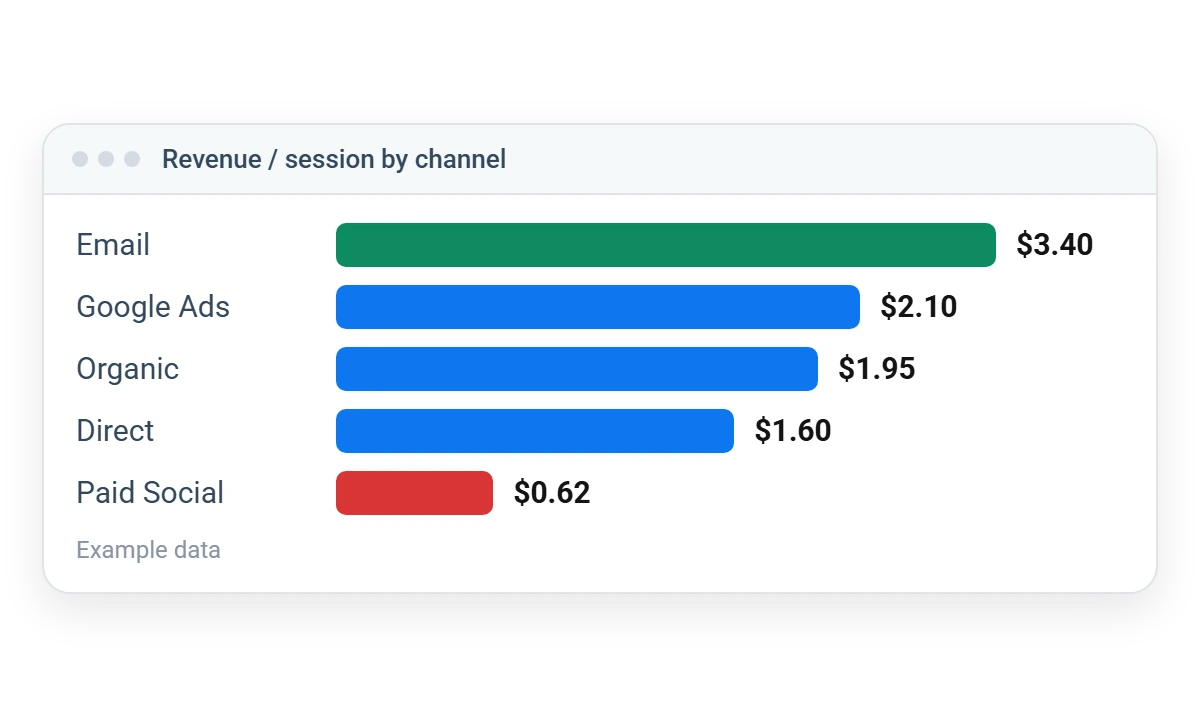
Revenue per session by channel — not just clicks and visits
Built for business owners who pay for traffic and want a straight answer:





Every day a broken landing page eats your ad budget. Traffic Value shows which one — in minutes.
Install Plerdy on your site
Set a goal or connect e-commerce tracking
See every channel and landing page with a diagnosis
Fix critical pages first and compare periods
One table instead of five reports: money, diagnosis and the evidence behind it.
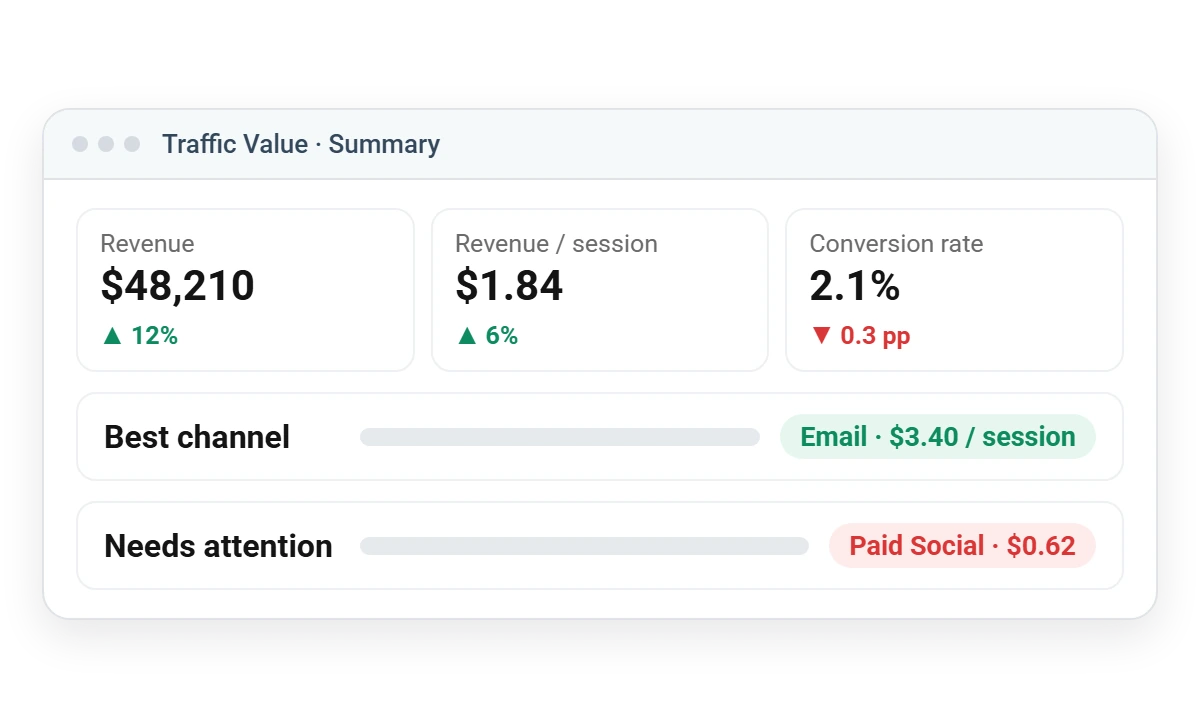
Revenue, revenue per session, goals and conversion rate — each compared with the previous period
Good, Traffic Problem, Landing Problem, Complex or Critical — with suggested next steps
Paid pages with heavy bounce and no conversions are marked Critical
The channel that earns most per session — and the one furthest below your site average
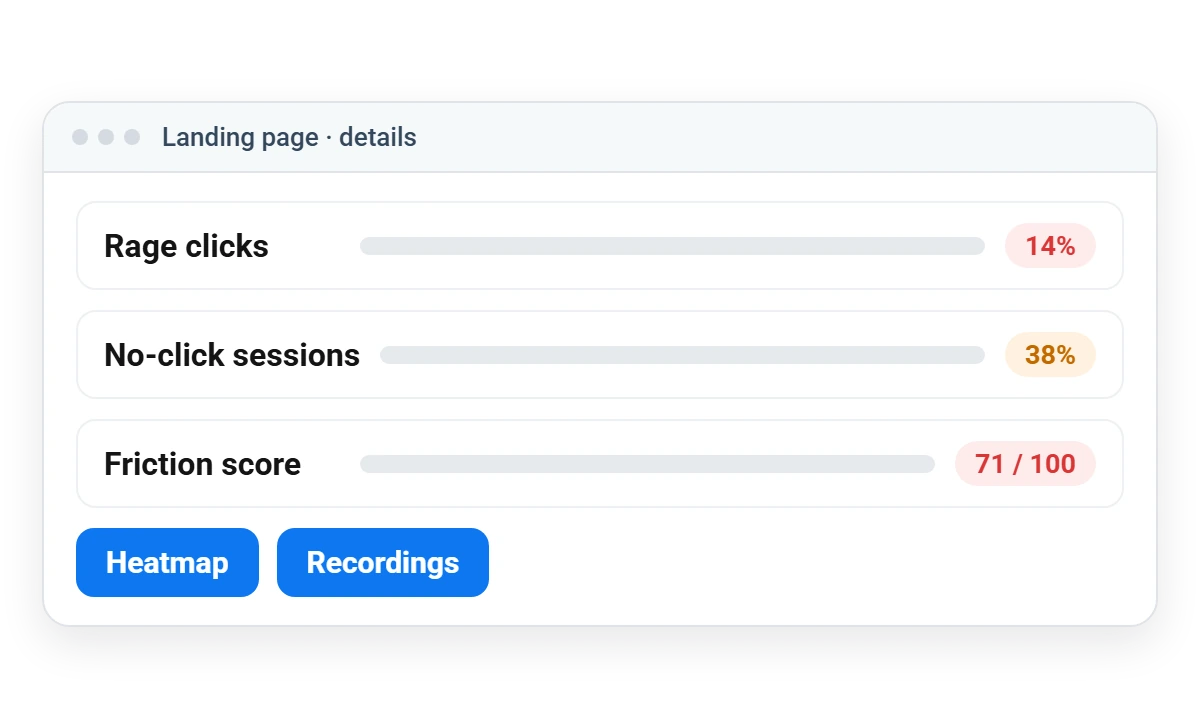
Rage clicks, no-click sessions, scroll depth, engaged sessions, Trust and Friction scores
Open the heatmap or session recordings of any landing page right from the table
Count form submissions or thank-you page visits — Plerdy suggests goals from your data
Country, device, traffic source, landing page search and comparison period
A read-only link for a client or colleague — no Plerdy login needed
Orders, AOV and products behind every channel’s revenue
See what visitors of a “Landing problem” page click and ignore
Watch the rage-click sessions behind a Critical page
Discover why customers love Plerdy's comprehensive and intuitive web optimization tools, as acclaimed on G2.com










Traffic Value is Plerdy’s lost revenue finder. It shows every traffic channel and landing page with sessions, conversions, revenue and a diagnosis, so you see where your traffic turns into money and where it leaks.
It is rule-based: Plerdy looks at sessions, conversion rate, bounce rate and whether the channel is paid. Pages with fewer than 30 sessions are marked as still collecting data, so small samples don’t mislead you.
No. Without it, Traffic Value uses your conversion goal — a form submission or a thank-you page visit. With e-commerce tracking you also get revenue, AOV and revenue per session.
Google Ads, Google Organic, Paid Social, Social, Email, Referral, Direct and Other — detected from UTM tags and referrers.
The Needs attention card estimates the gap for the weakest channel: its sessions multiplied by how far its revenue per session (or conversion rate) is below your site average.
Google Analytics reports numbers per channel. Traffic Value connects each landing page to a diagnosis, behaviour signals and the heatmap and recordings of the same visits.
Yes. The Share button creates a read-only link — no Plerdy login needed.
316+ G2 reviews
Content for UX designers, SEO specialists, and business owners