
You want fast UX wins, not long meetings. Plerdy Heatmap Chrome Extension is my quick hack: open the website, hit the chrome icon, and get a heatmap view with hints for CRO. The extension shows where eyes go, where clicks fail, and what blocks slow users. It’s simple: one website, one scan, clear next steps. I use the extension before wireframes, after copy edits, and when a website feels noisy—fast signals, less guessing, more confident ship for busy teams today.
What The Extension Actually Does
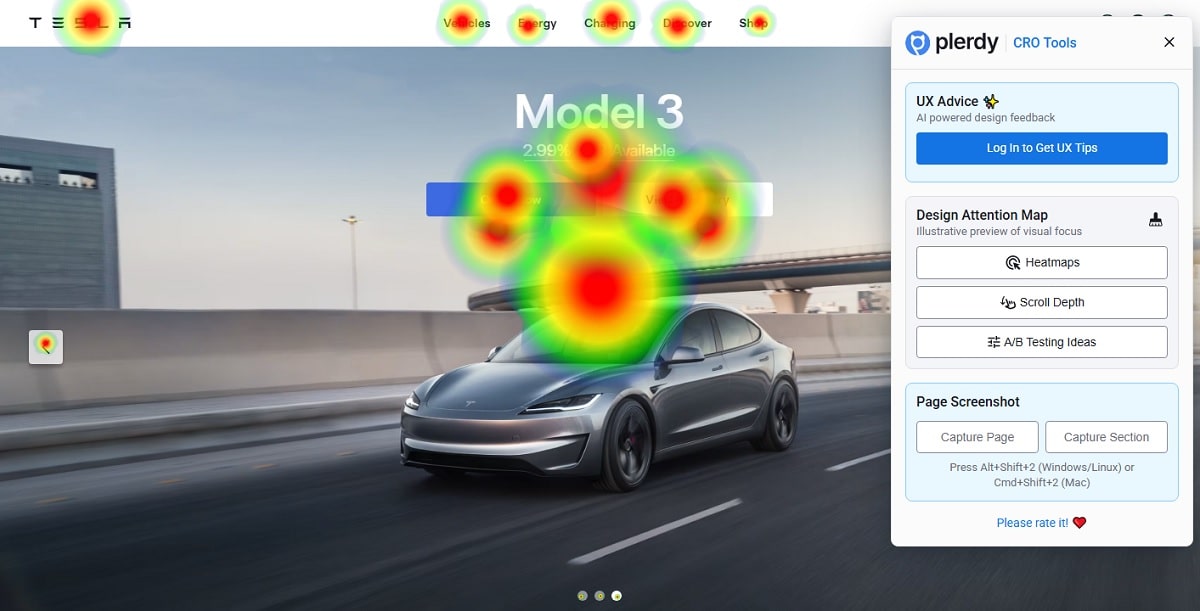
Heatmap Analysis (Prediction)
This heatmap view shows where eyes go first on your website. You run it in chrome through the extension—fast and no code. I use it to spot hot zones in hero, dead CTAs, and blind menu paths on pages for Shopify or Notion.
- Hotspots on CTA or hero (heatmap + website context).
- Blind spots: footer nav, side widgets, tiny labels.
- Skim clicks steal 20–30% above the fold.
- Extension in chrome = one tap, one map.
Scroll-Depth (Prediction)
This view shows predicted scroll depth on your website, a simulation from learned patterns—not real users. You run it in chrome via the extension to guess where attention may drop and plan layout before tests.
- Common drop zones appear around 35–55% depth on content-heavy pages.
- Header carousels or popups can cut predicted reach to the second screen.
- Pair with heatmap prediction to balance hero vs body before you ship.
AI UX Tips (Page-Wide)
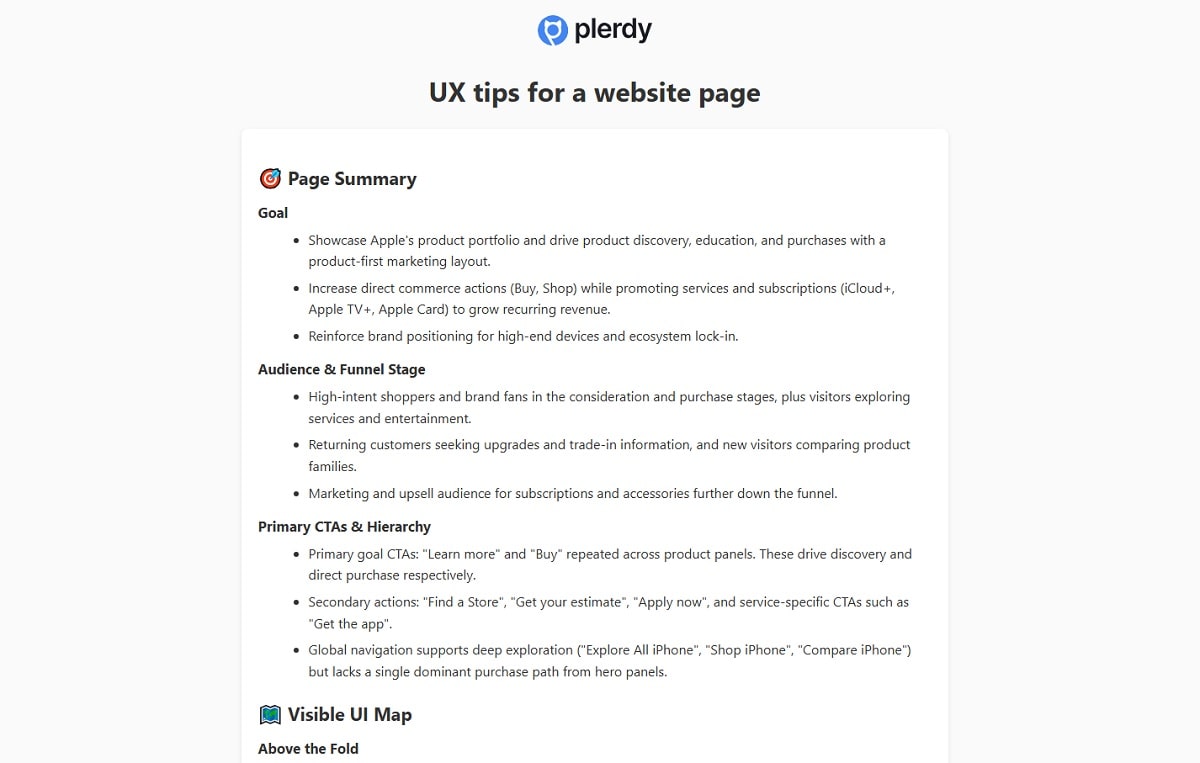
Inside the chrome extension you can generate an AI report called “UX tips for a website page.” It scans the website in your current tab, pairs the heatmap context with heuristics, and spits clear, ranked advice. It’s prediction, not real users, but super practical for fast edits.
- Sections you get: Page Summary, Visible UI Map, Heuristic Scores (1–5), Quick Wins vs Strategic Work, plus A/B test ideas.
- What it calls out: goals, CTAs, nav load, readability, forms, accessibility; each item has Priority (P0/P1/P2) and Effort.
- How to use: open the website in chrome, run the extension, read the tips, ship 3–5 edits, re-check heatmap; teams often report +5–12% micro-CTR moves.
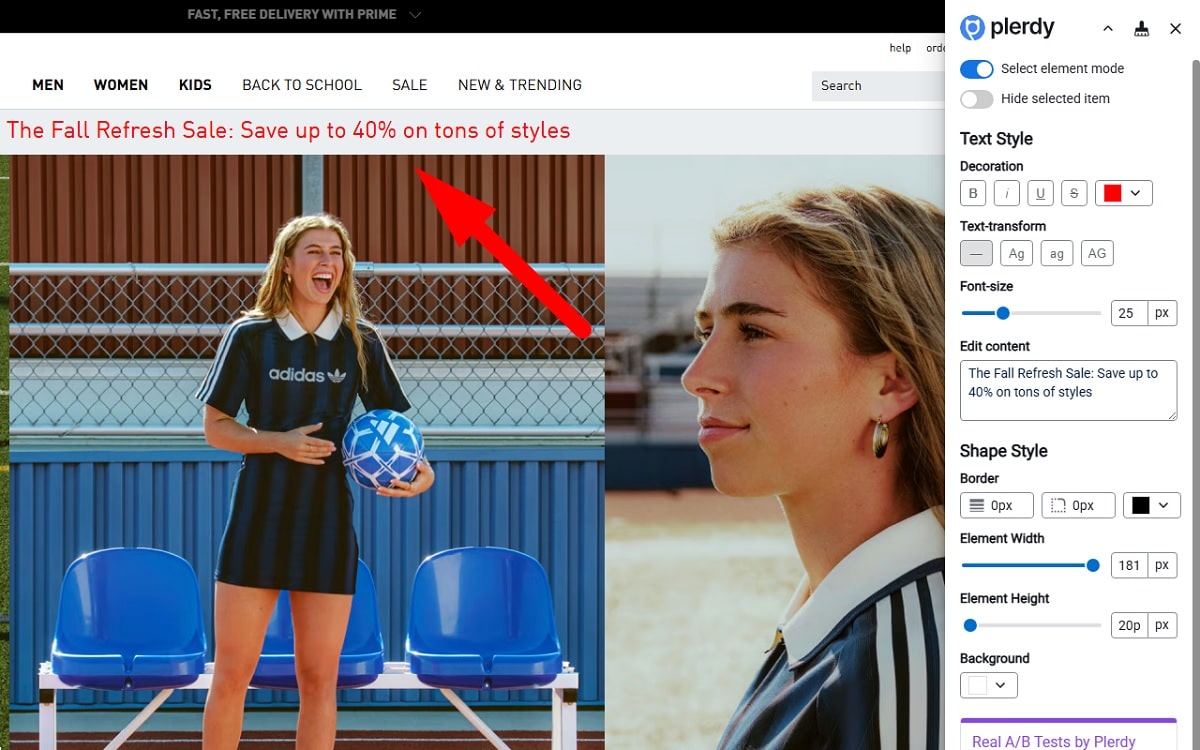
Screenshots & Share
Capture full page in chrome, mark arrows, send to the team. Fast proof beats arguments. Your website changes get context, not drama.
- One screenshot = one decision.
- Comment pins for dev/PM/UX.
- Share in Slack or email in seconds.
Predictive Vs Real Analytics: When To Use Each
When Predictions Shine
Use prediction when you need speed. New website? Fresh landing? The chrome extension throws a heatmap view in seconds, so you sketch direction before big work. Great for wireframes, hero layout, CTA order, and rough content. I use it pre-launch, design reviews, and quick sanity checks at 80% confidence daily.
When Real Data Wins
Use real analytics when money is on the table. After the website goes live, you need confirmed clicks and sessions. Turn on Plerdy Website Heatmap Tool (script), not only the chrome extension. The heatmap shows paths and rage-clicks. Open chrome; the extension gives context, the website dashboard gives real numbers.
How To Combine
Blend both to stay sane and fast.
- Pre-research — open the website in chrome, run the extension, scan heatmap and scroll prediction for quick signals.
- Hypotheses — write 3 ideas with impact guess (10–20%).
- Validation — track real clicks and conversions, compare before/after, ship the winner care.
Workflow: From Audit To A/B Test
Quick Scan In The Extension
Open the chrome extension, hit scan, and get a heatmap plus scroll prediction for your website in under three minutes. I check hero message, first CTA, sticky header, and banners, Figma handoff. Quick gut test: if heatmap tells the same story twice, you feel direction.
Prioritize Issues
Now sort what matters, fast, inside chrome today with context.
- Impact — rough % lift if fixed on the website; note primary goal.
- Probability — supported by heatmap patterns and screenshots from the extension.
- Effort — design or dev hours; check sprint capacity and chrome console blockers.
- Risk — could the change break flows, SEO, or revenue for stakeholders?
Create Test Ideas
Draft tests the moment the extension points a direction, keep flow simple, ship fast today.
- Copy variant — punchier headline or value line; keep website tone.
- Layout — rearrange blocks; heatmap hint guides fold, cards, spacing, then measure drop risk calmly.
- CTA/placement — move primary action; chrome preview; aim +10–15% reach to button.
Metrics & Evidence To Track
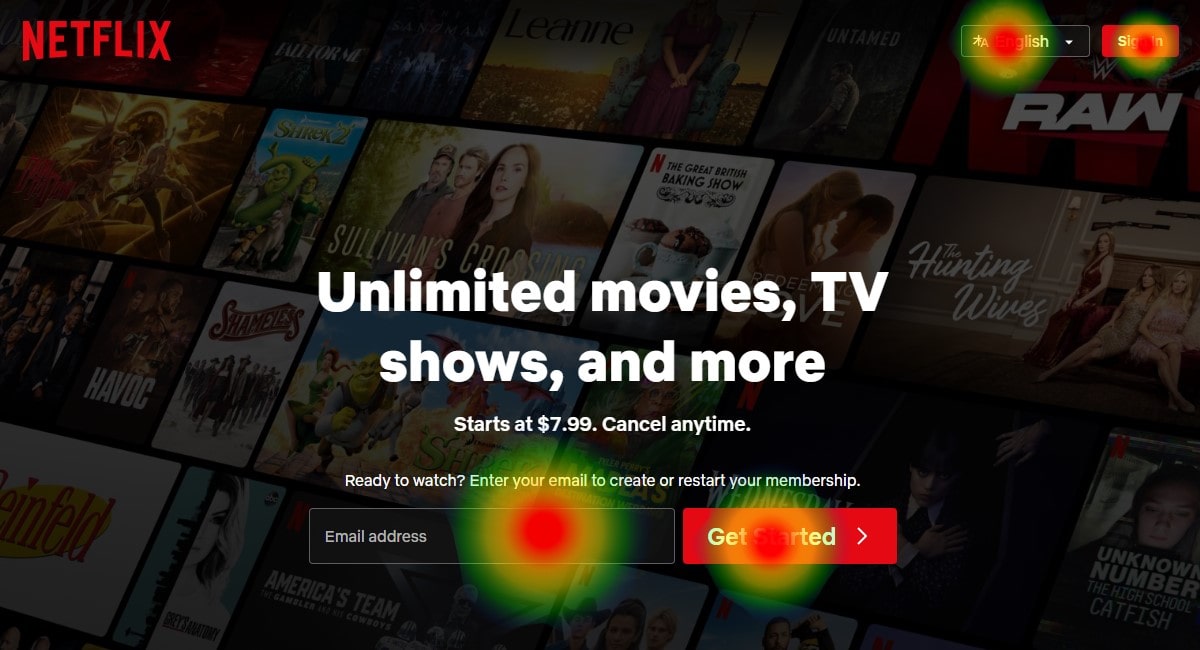
Engagement Signals
Use the heatmap in the chrome extension to prove attention, not guess. Run it on the website after each edit and compare trends week by week. Small wins stack.
- CTR on hero and cards
- Hover over key elements
- Scroll reach per section
- Reading depth by blocks
- Rage-clicks on UI traps
Conversion Signals
Now the serious part: did the website make money or not. Track micro to macro. Button taps, form start, form submit, add-to-cart, purchase. Tag the heatmap screenshots from the chrome extension to each release. Aim for +8–15% on the main goal and keep segments consistent.
Research Velocity
Speed is a metric too. Count days from idea to test to change. When the website flow moves fast, you learn more. The chrome extension cuts review time; the heatmap reduces debates. Target two iterations per week, 20–30% fewer meetings, and cleaner handoffs to dev.
Who Benefits & Typical Use Cases
Marketers
You move fast, you need proof without drama. The heatmap in the chrome extension gives quick story of the website hero and CTA zones. Use it before ads burn cash.
- Landing pages for Shopify/WooCommerce — heatmap shows first-screen gaps; website copy gets sharper.
- PDP/PLP clean-up — chrome extension flags dead tiles; website cards get fewer bounces.
UX Designers
You want signal, not noise. The extension runs in chrome while you sketch flows in Figma/Webflow and check spacing. Heatmap hints save rounds with stakeholders.
- Information architecture — website sections reordered after heatmap patterns point confusion clusters.
- Component audits — chrome extension screenshots speed reviews with design tokens and spacing fixes.
Product Managers & Founders
You care about speed to impact. Run the extension in chrome during standups, then commit. Two sprints, visible movement.
- Roadmap priorities — website areas with heatmap drop zones jump first in backlog.
- Quick wins — extension notes push 10–15% uplift on key journeys; teams align without extra meetings.
Install & First Run — Updated
Do it fast in chrome, no drama.
- Open the Chrome Web Store and search: Plerdy UX & Usability Testing — pick the extension by Plerdy, with the heatmap in screenshots.
- Click Add to Chrome → Add extension to install it.
- Pin the extension via the puzzle icon in chrome so it stays near your address bar.
- Open your website, hit the extension icon, and start a quick scan.
- Review the heatmap preview on the website, note the first hints, continue editing.
Permissions Explained
Chrome shows a small modal first. The extension reads page HTML to render a heatmap and screenshots. It runs on the active website tab when you click—no background crawl, no hidden pages. No forms or passwords are captured. If your team uses Figma or Slack, that’s fine; chrome scope stays page-level.
Data & Privacy
Prediction ≠ personal data. The extension produces simulated heatmap signals on your website; no user identity, zero profiles. Need real clicks? For real clicks, install Plerdy Website Heatmap Tool by adding the JS script to your website and track GA4-style events in your Plerdy account. Data stores in your Plerdy account; you control retention, export, remove. Clean setup, clear trail, less stress.
Conclusion: What To Do Next
That’s the move: run fast and ship smarter. With the Plerdy extension in chrome, your website stops guessing and shows predicted paths. The heatmap view trims noise and saves hours. Small 10–15% wins stack. Real momentum, not drama.
- Open chrome, pin the extension, run the heatmap scan on your website.
- Write three hypotheses, tweak website blocks, re-check heatmap in the extension.
- Turn on real tracking; compare before/after in chrome dashboards.