
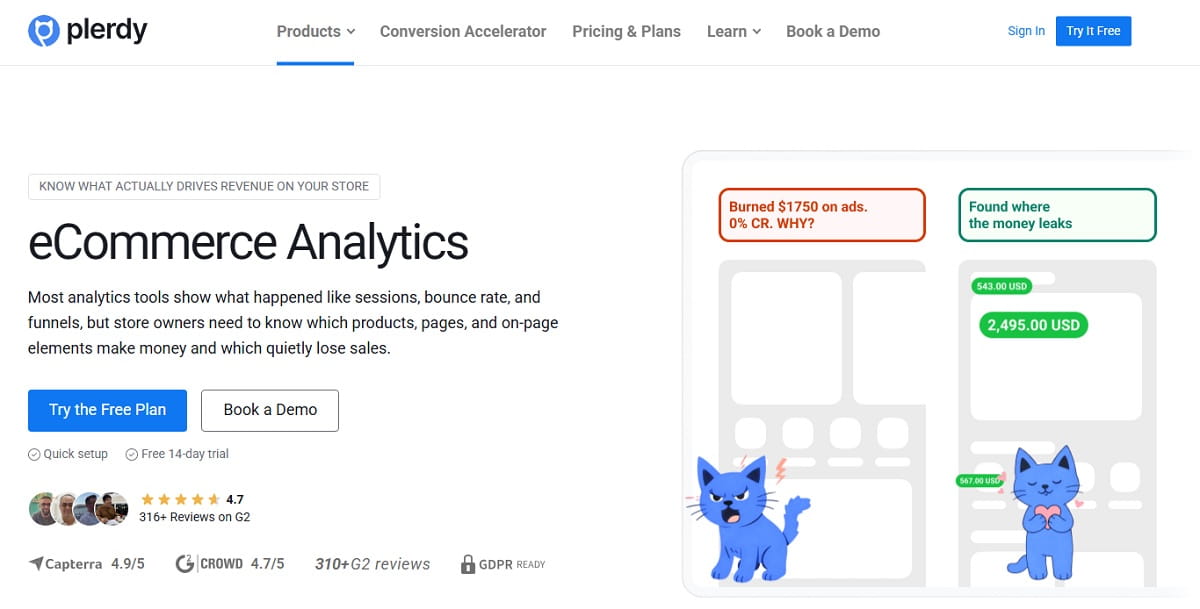
Most stores already collect data. They have traffic reports, order counts, product views, and dashboards full of movement. But that still leaves one annoying question unanswered: which page elements actually help sales? That is where Plerdy Ecommerce Analytics becomes useful. Instead of looking at traffic in isolation, Ecommerce Analytics helps you connect purchases to the clicks and on-page interactions that happened before the order.
Plerdy Ecommerce Analytics is built for practical ecommerce work, not for pretty reporting. With this Ecommerce Analytics view, you can see which elements influence purchases, which pages support revenue, which products deserve more exposure, and which traffic sources bring buyers instead of empty visits. In other words, Ecommerce Analytics gives an ecommerce team a faster way to see what drives money.
This guide explains how to use Plerdy Ecommerce Analytics step by step. You will see how to set up Ecommerce Analytics, how to read Ecommerce Analytics reports, how to check which elements influence revenue, and how to turn Analytics data into changes that improve store performance.
What Plerdy Ecommerce Analytics Actually Helps You See
Why Ecommerce Analytics Is More Useful Than Basic Traffic Reporting
Basic Analytics can tell you how many users visited a page. Ecommerce Analytics goes further. Plerdy Ecommerce Analytics helps online stores understand which page elements influence sales. If a user clicked an element before buying, that interaction can be tied to the value of the completed purchase. That is the part many ecommerce teams miss when they only use standard Analytics dashboards.
This is why Ecommerce Analytics matters. A homepage banner may get many clicks and still have weak sales impact. A category filter may get fewer interactions and still influence more purchases. A sticky add-to-cart button, shipping note, trust badge, recommendation block, or product label may quietly support more revenue than the team expected. Plerdy Ecommerce Analytics helps you see those connections clearly.
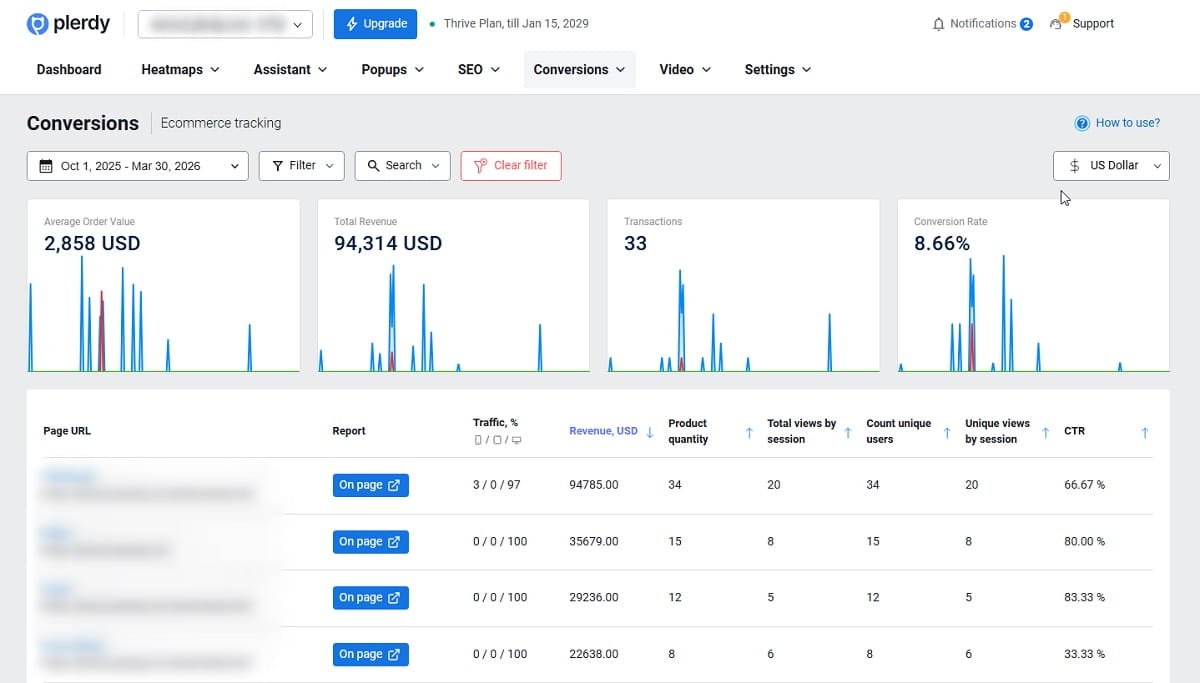
Inside Plerdy Ecommerce Analytics, you can review Profitable Pages, Push Or Pause Products, Winning Traffic Sources, Sales Over Time, Total Online Profit, Average Order Value, Conversion Rate Over Time, Purchased Items and Basket Insights, Pageviews Per Session, Navigation Paths, Page Depth Impact On Purchases, Profit By Website Elements, Distinct Page Analysis, and Customer Acquisition Source. That makes Ecommerce Analytics much more action-focused than a simple traffic report.
The point of Ecommerce Analytics is not to collect more numbers. The point is to connect Analytics to revenue decisions. When you open the tool, you should be able to say: this block helps sales, this product deserves more placement, this channel brings low-value traffic, and this page needs changes now.
Action: Open Plerdy Ecommerce Analytics with one practical question: “Which pages and elements are influencing revenue right now?” That keeps your Analytics review tied to money, not noise.
What To Check First In Plerdy Ecommerce Analytics
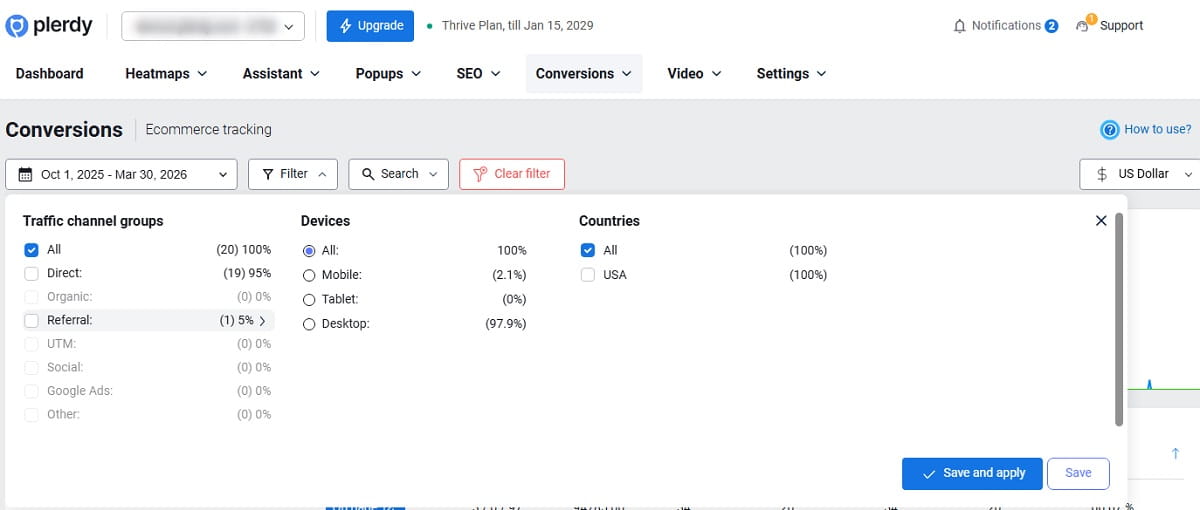
If you are opening Ecommerce Analytics for the first time, do not jump randomly between reports. Use a simple order.
- Start with Sales Over Time, Total Online Profit, Average Order Value, and Conversion Rate Over Time. This gives your Ecommerce Analytics review a baseline.
- Then open the main revenue pages: homepage, category page, product page, cart, and checkout. These pages show where ecommerce revenue is influenced most directly.
- After that, review Profit By Website Elements and Order-Level Analysis. This is where Ecommerce Analytics becomes specific enough to guide design, merchandising, and CRO changes.
This sequence matters because Analytics without order becomes messy. First, understand store-level revenue. Second, compare key pages. Third, inspect page elements and buyer behavior before purchase.
Action: In your first Ecommerce Analytics review, use a 14-day or 30-day period. That usually gives enough Analytics data for patterns without making the report too noisy.
How To Set Up Plerdy Ecommerce Analytics
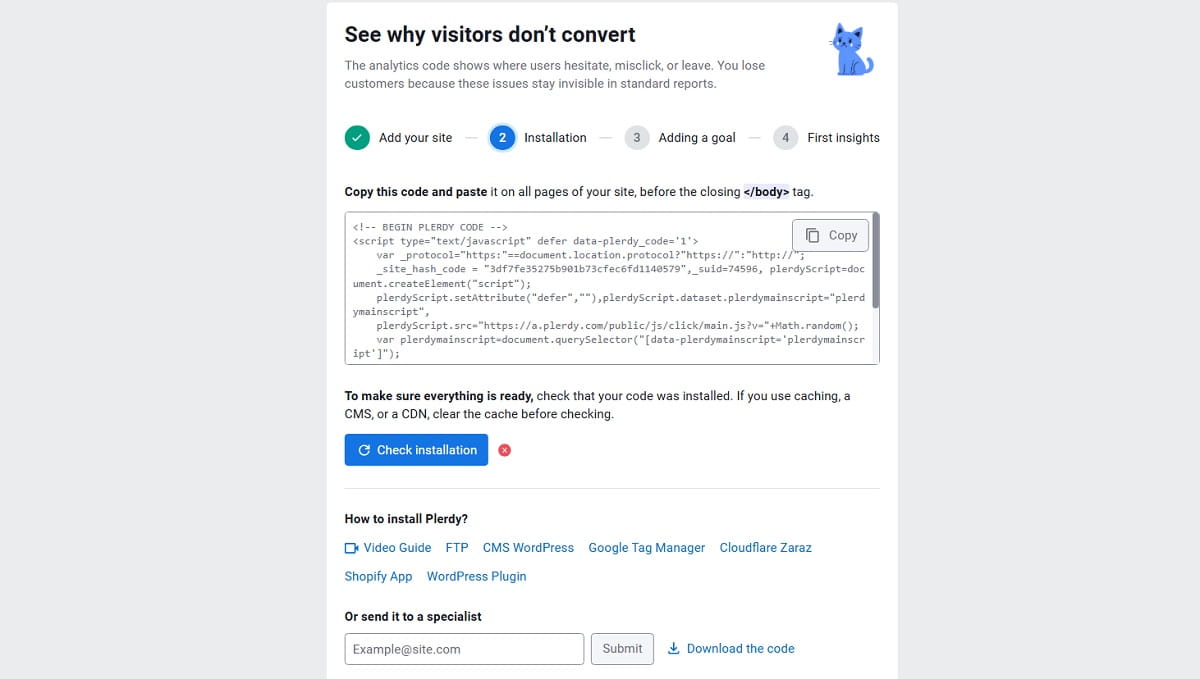
Add The Extra Tracking Code To The Thank You Page
Plerdy Ecommerce Analytics setup is intentionally fast. To make Ecommerce Analytics work correctly, you need to add an extra tracking code to the Thank You page. This setup step is what allows Plerdy to connect completed purchases with earlier clicks on store elements.
That one part matters a lot. Without this Thank You page code, your Analytics data may show activity, but Ecommerce Analytics will not be able to tie revenue to the elements users interacted with before purchase. So if you want real Ecommerce Analytics, not partial reporting, the Thank You page setup has to be correct.
Use A Developer Or A Plugin For Faster Ecommerce Analytics Setup
In most cases, a developer can handle Plerdy Ecommerce Analytics setup in about 10 minutes. It is usually a small implementation task, not a long Analytics project. For WordPress and Shopify stores, plugins may help add the Ecommerce Analytics code automatically, which makes the setup even easier.
If the store has a custom checkout or a custom Thank You page, it is smart to ask the developer to confirm that purchase data is passed correctly. A quick check at this stage can save a lot of bad Analytics interpretation later.
Verify That Ecommerce Analytics Is Receiving Purchase Data
After installation, place a test order or wait for real orders to appear. Then check whether Plerdy Ecommerce Analytics can show purchase-linked behavior. If Sales Over Time updates but Profit By Website Elements looks empty, the Ecommerce Analytics setup usually needs another check on the Thank You page implementation.
Once the setup is verified, Ecommerce Analytics becomes much more useful because the tool can connect real orders to earlier clicks and page interactions. That is the point where Analytics becomes actionable.
Action: Do not start serious Ecommerce Analytics decisions until the Thank You page code is confirmed and purchase-linked Analytics data appears correctly.
How To Use Ecommerce Analytics To Check Which Elements Influence Purchases
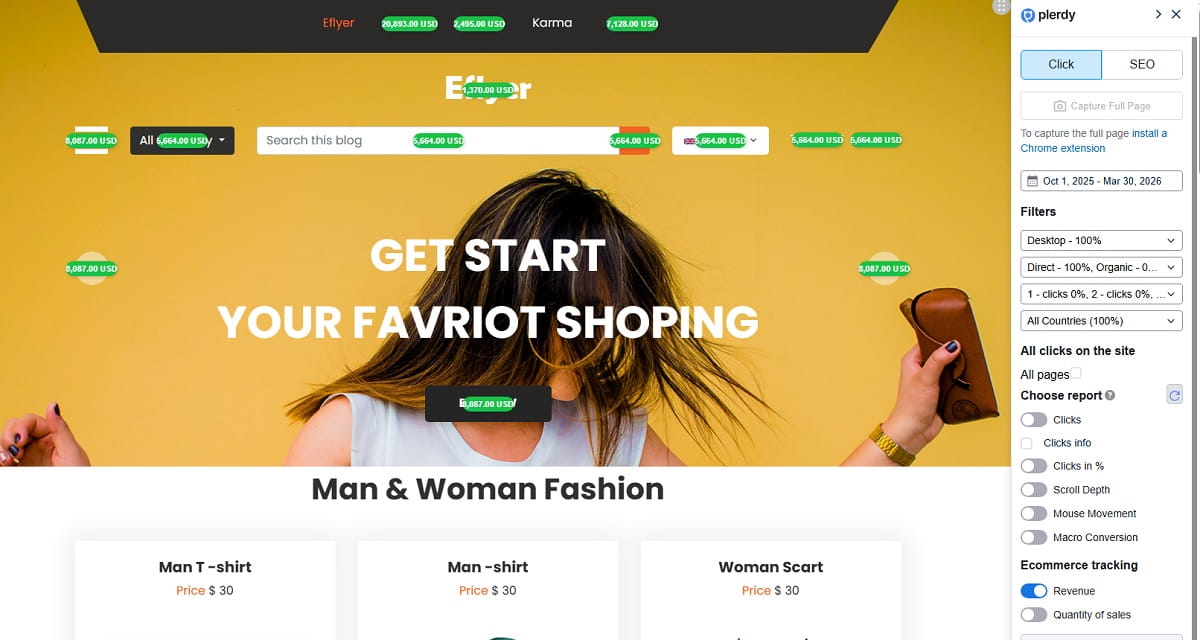
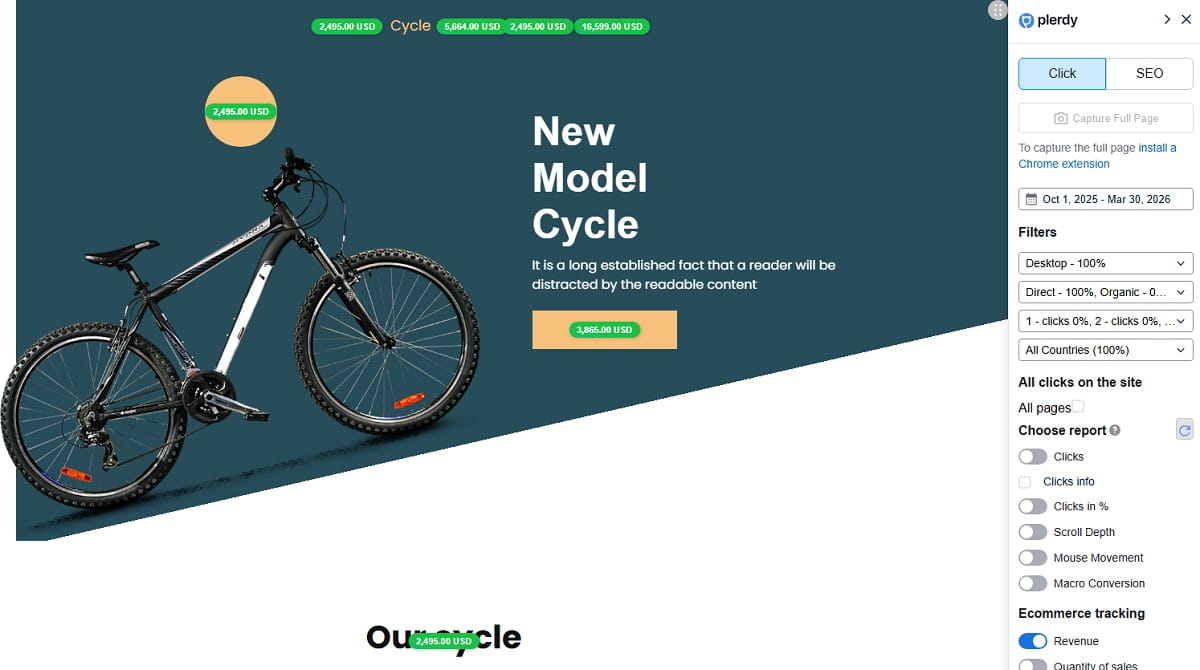
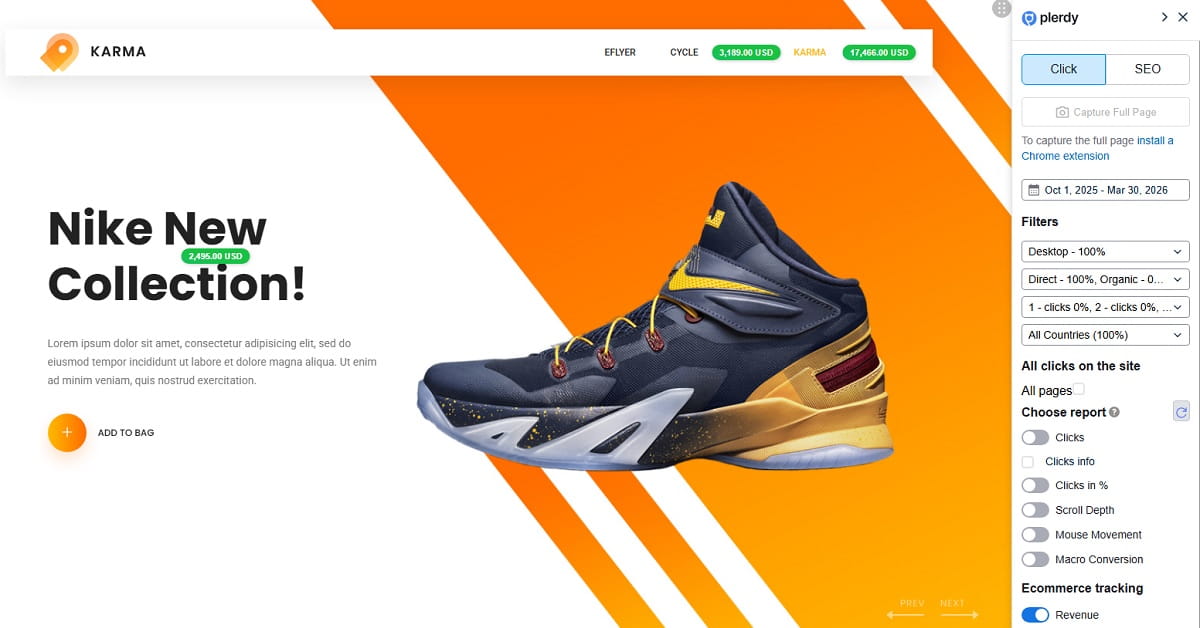
Open Profit By Website Elements First
This is one of the most practical parts of Plerdy Ecommerce Analytics. You can review which elements customers clicked before buying and see how those clicks connect to purchase value. For ecommerce teams, this is where Analytics stops being generic and starts becoming revenue-focused.
Check the elements that usually shape ecommerce behavior most: product cards, filters, sort controls, navigation links, promo strips, recommendation widgets, delivery notes, reviews, category banners, sticky buttons, coupon blocks, and trust elements. Plerdy Ecommerce Analytics helps you see which of these elements support revenue and which ones mostly create visual activity.
How To Read Ecommerce Analytics Element Impact
When reviewing Ecommerce Analytics, there are four patterns to watch:
- High clicks, low revenue impact: the element attracts attention but does not support purchases well. In Ecommerce Analytics terms, this often means the block is loud but weak.
- Low clicks, high revenue impact: this is often a hidden ecommerce winner. The element may be underexposed, but its Analytics value is strong.
- High clicks, high revenue impact: this is a strong revenue element. Ecommerce Analytics shows that it deserves protection and careful testing.
- Low clicks, low revenue impact: the element may be clutter. In Analytics, it is taking space without helping the buying flow.
If an element does not influence sales, it should be improved, changed, moved, or deprioritized. If an element strongly influences sales, it should be protected, strengthened, tested, or featured more prominently. That is one of the clearest rules inside Ecommerce Analytics, and usually one of the most profitable.
A Practical Ecommerce Analytics Example On A Category Page
Imagine a category page with a large lifestyle banner at the top, filters below, and product cards farther down. Ecommerce Analytics may show that the banner gets many clicks but contributes little to orders. At the same time, shoppers who use the filter block and then interact with specific product cards generate stronger purchase value. That Analytics result tells you exactly what to do: reduce the dominance of the banner, move filters higher, improve product grouping, and feature the products that actually support revenue.
This is where Ecommerce Analytics beats standard page Analytics. It shows not just movement, but influence on revenue.
Action: Use Ecommerce Analytics on one category page or one product page first. Mark three elements as strong, weak, or unclear, then decide what to change.
How To Use Ecommerce Analytics To Analyze Revenue By Pages, Products, And Placements
Review Revenue Pages In A Clear Ecommerce Analytics Order
When using Plerdy Ecommerce Analytics, review pages in this order:
- Checkout
- Cart
- Product Pages
- Category Pages
- Homepage
This helps because Ecommerce Analytics usually reveals the clearest friction on pages closest to purchase. If mobile checkout performs poorly, fixing the homepage first will not solve the real revenue problem. If the cart underperforms, a prettier banner will not rescue conversion.
Use Distinct Page Analysis to inspect one page at a time. Segment by page title or URL when you want more granular Ecommerce Analytics comparisons. For example, compare one category template to another, or compare one product family against the rest of the catalog.
Use Profitable Pages In Ecommerce Analytics To Find What Supports Sales
Profitable Pages is one of the most valuable Ecommerce Analytics views because it separates pages that assist purchases from pages that only attract visits. In many ecommerce stores, the pages with the most traffic are not always the pages with the strongest revenue contribution.
Look for pages with healthy conversion support, strong order value, and clear revenue influence from important elements. Those pages often give you the best ecommerce patterns to repeat across the rest of the store. Sometimes the smart Analytics move is not to invent a new layout. Sometimes it is just to copy the structure from the page that already sells well.
Use Push Or Pause Products And Basket Insights
Good Ecommerce Analytics is not only about pages. It is also about merchandising. Plerdy Ecommerce Analytics helps you decide which products deserve stronger placement and which products should stop taking premium space.
Use Purchased Items and Basket Insights to see what appears often in completed orders, what lifts average order value, and what products work well together. If a product appears often in purchased baskets and influences stronger orders, Ecommerce Analytics suggests it deserves more visibility. If another product gets traffic but rarely appears in completed baskets, the Analytics signal may tell you to pause the push, improve the page, or change the placement.
Use Pageviews Per Session, Navigation Paths, And Page Depth
Pageviews Per Session and Navigation Paths help you see how buyers move before purchase. Page Depth Impact On Purchases adds another Ecommerce Analytics layer by showing whether important content is placed too low to influence enough users.
A common ecommerce issue is this: useful content exists, but it sits too far down the page. Desktop users may still find it. Mobile users often do not. Ecommerce Analytics helps you see that difference and adjust the structure before more revenue is lost.
Action: In your Ecommerce Analytics review, compare your top three revenue pages and ask which structure should be copied to other pages.
How To Compare Traffic Sources And Devices In Ecommerce Analytics
Use Ecommerce Analytics To Find Winning Traffic Sources
Not every channel brings buyers. Some channels bring active-looking traffic with weak purchase value. Others send fewer users but generate stronger revenue. Plerdy Ecommerce Analytics helps you compare traffic sources by actual business impact, not just by visit volume.
Use Traffic Channel Filters and Customer Acquisition Source reports to compare ecommerce channels by revenue, average order value, conversion quality, and purchase behavior. Paid social may look strong in standard Analytics but weak in Ecommerce Analytics. Organic search may bring fewer visits and still perform much better on revenue. Email may bring smaller traffic and stronger buyers. That is why Ecommerce Analytics matters.
Compare Mobile Vs Desktop With Ecommerce Analytics
Device comparison is another place where Ecommerce Analytics becomes valuable fast. A store can look fine in aggregate Analytics while mobile quietly underperforms. That is a dangerous blind spot.
In Ecommerce Analytics, compare:
- Conversion Rate Over Time by device
- Average Order Value by device
- Navigation paths before purchase
- Page depth impact on mobile vs desktop
- Element-level revenue influence on product, cart, and checkout pages
If desktop buyers convert well and mobile buyers struggle, Ecommerce Analytics often reveals the real issue: weak layout hierarchy, hard-to-use filters, hidden content, cluttered product blocks, or checkout friction on smaller screens. Standard Analytics can hint at that. Ecommerce Analytics makes it much clearer.
Use Real-Time Monitoring For Fast Ecommerce Analytics Checks
Real-Time Monitoring is useful when you launch a campaign, change a placement, feature a product more aggressively, or adjust a homepage block. Ecommerce Analytics gives you a faster read on whether the change affects revenue behavior in the right direction. That is especially useful when an ecommerce team needs a quick signal, not a week of waiting.
Action: Before increasing ad spend, use Ecommerce Analytics to compare revenue, AOV, and conversion by traffic source and by device. Fix the weak channel-device combination first.
How To Turn Ecommerce Analytics Insights Into Revenue Actions
What To Do With Underperforming Elements
If Ecommerce Analytics shows that an element has low sales impact, do not rush into a full redesign. Start with direct improvements:
- Move the block higher or lower based on page depth Analytics.
- Rewrite the message so it supports purchase intent better.
- Reduce visual competition around the element.
- Replace the block type if the current format is weak.
- Remove or deprioritize the element if Ecommerce Analytics shows it adds clutter without helping revenue.
That is one of the best uses of Ecommerce Analytics. It lets you fix the exact weak point instead of rebuilding the whole page because the team feels uncertain.
What To Do With High-Performing Elements
If Ecommerce Analytics shows that an element strongly influences purchases, protect it. Do not let it disappear in a redesign because somebody wanted a cleaner page. Strengthen it carefully. Give it more visual priority, better placement, or cleaner support from nearby content.
When an element already drives money, the Analytics lesson is simple: do not break it casually. Improve it with care.
How To Use Ecommerce Analytics To Push Better Products
Plerdy Ecommerce Analytics is also useful for product exposure decisions. Move better-converting products higher on category pages. Give them more homepage visibility. Support them with better collection placement. Pair them with products that lift basket value. Stop giving premium space to products that look attractive in standard Analytics but perform weakly in Ecommerce Analytics.
Build A Small Weekly Ecommerce Analytics Routine
A simple Ecommerce Analytics routine works better than occasional deep dives:
- Review Sales Over Time, Total Online Profit, AOV, and Conversion Rate.
- Check the top revenue pages.
- Compare mobile vs desktop.
- Compare traffic channels by revenue quality.
- Choose two or three revenue actions only.
- Review the next period in Ecommerce Analytics and compare the result.
This is how Ecommerce Analytics becomes practical. Not endless dashboards. Not vague Analytics meetings. Just better revenue decisions, made faster.
Action: Use your next Ecommerce Analytics review to choose only a few changes: improve one weak element, strengthen one strong element, and feature one product or channel that already proves revenue value.
Common Mistakes To Avoid When Using Ecommerce Analytics
Using Sessions As The Main Metric
Basic Analytics can be helpful, but sessions do not tell the whole ecommerce story. Ecommerce Analytics is more useful because it shows which behavior connects to purchases.
Judging Elements By Click Volume Alone
A high-click element is not always a strong-selling element. Ecommerce Analytics helps you compare clicks against real purchase influence.
Skipping Thank You Page Validation
If the Thank You page code is not implemented correctly, Ecommerce Analytics may miss the revenue connection that makes the tool valuable. Always verify the setup.
Changing Too Many Things At Once
If you change the homepage, category layout, product page, and traffic strategy in the same period, the Analytics signal gets blurry. Ecommerce Analytics works best when you make focused changes.
Ignoring Mobile Ecommerce Analytics
Many ecommerce stores still underestimate mobile friction. A store can look stable in total Analytics while mobile quietly loses revenue. Always compare devices inside Ecommerce Analytics.
Action: If your Analytics report looks interesting but still does not tell you what to change on the store, keep digging until the Ecommerce Analytics result points to a real action.
Conclusion
How To Use Plerdy Ecommerce Analytics To Increase Store Revenue is really about one shift: stop guessing and start reading revenue-linked behavior. Plerdy Ecommerce Analytics helps you connect purchases to clicks, pages, products, placements, channels, and devices. Once Ecommerce Analytics is set up correctly, you can review your key revenue pages, identify the elements that influence sales, improve weak blocks, protect strong ones, and focus budget where the Analytics actually supports growth. Test the tool on your main ecommerce pages first, review what drives purchases, and improve what truly affects revenue.
FAQ
How Does Plerdy Ecommerce Analytics Setup Work?
Plerdy Ecommerce Analytics setup requires adding an extra tracking code to the Thank You page. That setup allows Ecommerce Analytics to connect completed orders with the page elements users interacted with before purchase.
Do I Need A Developer To Install Ecommerce Analytics?
Usually, yes, but the task is normally quick. In many stores, a developer In many stores, a developer can install the Plerdy Ecommerce Analytics code in about 10 minutes. For Shopify and WordPress stores, plugins may also help with Ecommerce Analytics setup.
What Pages Should I Check First In Ecommerce Analytics?
Start your Ecommerce Analytics review with checkout, cart, product pages, category pages, and then the homepage. These pages usually show the clearest relationship between Analytics data and revenue impact.
How Can Ecommerce Analytics Show Which Elements Drive Revenue?
Plerdy Ecommerce Analytics shows which elements users clicked before purchase and ties those interactions to completed order value. That helps you use Analytics to identify the blocks, buttons, and placements that actually support ecommerce revenue.
Does Plerdy Ecommerce Analytics Work For Shopify And WordPress?
Yes. Plerdy Ecommerce Analytics can work for Shopify and WordPress stores, and plugins may help add the required code for faster Ecommerce Analytics setup.
How Do I Compare Channels And Devices In Ecommerce Analytics?
Use Traffic Channel Filters, Customer Acquisition Source reports, and device comparisons in Plerdy Ecommerce Analytics. Check revenue, conversion rate, average order value, and navigation behavior by source and by device to make better ecommerce decisions.
What Should I Change After Ecommerce Analytics Finds Low-Impact Elements?
If Ecommerce Analytics shows that an element has low sales impact, improve it, move it, redesign it, or deprioritize it. If the element adds clutter without helping purchases, the Analytics result usually supports simplifying the page.
What Should I Do If Ecommerce Analytics Shows A Strong Revenue Element?
If Plerdy Ecommerce Analytics shows that an element strongly influences purchases, protect it first. Then test ways to strengthen it, such as better placement, stronger visibility, or support from nearby blocks that improve ecommerce conversion.