
You’ve got traffic. People land on your pages. And yet… sales don’t move, forms don’t get finished, and “Add to cart” clicks feel random. This is exactly where top heatmap software earns its keep. A good website heatmap tool doesn’t just show “what happened.” It shows where people hesitate, what they try to click (but can’t), and how far they actually scroll before bailing.
This guide is a practical comparison of the best heatmap software and website heatmap tools in 2026—based on research and reviews, not vibes. You’ll get quick picks by use case, a straight scoring rubric, a comparison table, and short-but-useful reviews of the most relevant heatmap analytics platforms (click heatmap tool, scroll heatmap, session recordings, funnels, and more). Then we’ll close with a decision framework and an implementation checklist you can actually follow without turning this into a six-week “analytics project.”
Quick Picks: Best Heatmap Software By Use Case
- Best for CRO teams who want heatmaps + next actions: Plerdy — heatmaps plus behavior analytics extras that push you into actual changes, not just screenshots.
- Best for simple “what are people clicking?” basics: Microsoft Clarity — free, fast to deploy, great for click heatmap and scroll heatmap sanity checks.
- Best for UX research workflows (heatmaps + surveys): Hotjar — strong feedback tools that pair well with heatmap analytics.
- Best for “classic heatmap tool for CRO” + A/B testing leaning: Crazy Egg — built around visual reporting and iterative testing.
- Best for teams who live in session recordings: Fullstory — powerful replay + diagnostic depth for complex products.
- Best for ecommerce teams watching checkout friction: Contentsquare — enterprise-grade user behavior analytics with journeys and advanced analysis.
- Best “budget-friendly with a lot of CRO extras” vibe: Lucky Orange — generous feature mix (recordings, heatmaps, chat/surveys depending on plan).
- Best for teams that want “pay for what you use” packaging: Smartlook — modular approach (recordings, events, funnels, heatmaps).
Quick note: these picks aren’t “forever truths.” They’re the most common wins we see in practice. Most wins come from pricing pages, checkout, PDPs, and lead forms. Not from redesigning your homepage because it feels boring.
What Is Heatmap Software And What It Actually Shows
Heatmap software is a category of user behavior analytics tools that visualizes how visitors interact with a page. Instead of staring at a conversion rate line chart, you see patterns: clusters of clicks, scroll drop-offs, and “why is everyone hovering there?” moments. A solid website heatmap tool usually supports a few types:
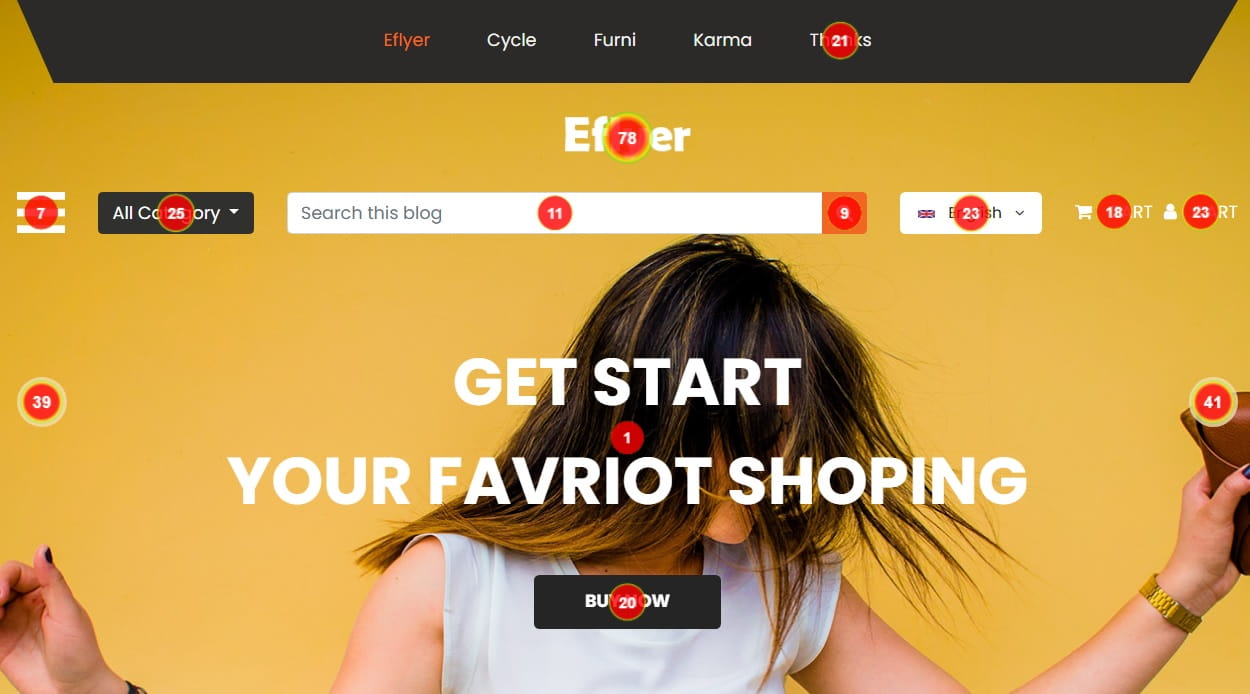
- Click heatmap: Shows where people click. This is where dead clicks pop out (clicking something that isn’t clickable) and where “fake buttons” get exposed.
- Scroll heatmap: Shows how far visitors scroll and where attention drops. If your CTA sits below the point where 70% stop scrolling, that’s not a copy problem.
- Move / hover heatmap: Tracks mouse movement (best treated as directional, not absolute truth). It’s useful for “are people even noticing this block?” questions.
- Attention heatmap: Often inferred (from scroll, timing, interaction signals). Helpful, but you should assume it’s an estimate, not a camera.
Practical examples that actually matter:
- You see rage clicks on a product image that looks like it should open a gallery, but doesn’t. That’s a UX promise you broke.
- Mobile-only users tap your shipping info accordion like five times. The element might be too small, too slow, or blocked by a sticky bar.
- Scroll heatmap shows a cliff right before pricing. You might be asking for trust before you’ve earned it.
This is where teams usually get stuck: heatmaps reveal “where,” but you still need session recordings (or funnels) to understand “what happened next.” The best heatmap analytics setup is heatmaps + recordings + a simple conversion goal. Not more dashboards.
How We Ranked These Heatmap Tools
We ranked tools using a scoring rubric designed for real-world CRO work. Not a vendor checklist. Different tools win in different contexts, and that’s fine. If approvals take a week, the sprint slows down—so workflow friction matters too.
- Heatmap types: Click heatmap, scroll heatmap, move/hover, and any advanced variants.
- Session recordings quality: Playback clarity, speed controls, event markers, and whether recordings help you diagnose friction fast.
- Segmentation filters: Device, traffic source, new vs returning, country, page variants, and custom tags/events.
- Funnels / goal tracking: Can you define steps, see drop-offs, and tie behavior to conversions?
- Targeting + sampling control: Can you focus on key pages and avoid “polluted” data?
- Privacy / GDPR support: Masking, consent handling, and clear data controls.
- Ease of setup: Tag installation, script weight concerns, and how fast you get a usable view.
- Integrations: Analytics, product tools, support tools, and export paths.
- Reporting / sharing: Links, exports, dashboards, notes, and “show this to a stakeholder without a 30-minute lecture.”
- Price-to-value: Not “cheapest.” Value for your traffic level and team workflow.
No BS note: this is not a PDF. It is shipped changes + validation. We prefer to test the highest-traffic step first so results show up faster. Heatmaps help you pick that step without guessing.
Heatmap Software Comparison Table (Features + Pricing)
| Tool | Best For | Key Heatmap Types | Funnels | Integrations | Pricing (Verified) | Free Trial |
|---|---|---|---|---|---|---|
| Plerdy | CRO teams needing heatmaps + practical action paths | Click, scroll (plus behavior overlays depending on setup) | Yes | Check vendor docs / integrations | Paid plans; example plan pricing shown on pricing page (verify tier fit) | 14-day trial |
| Hotjar | UX research + feedback workflows | Heatmaps (incl. click/scroll) + behavior views | Limited/depends on plan | Common analytics + workflow tools (verify list) | Free plan available; paid tiers: check pricing page | Yes (plan-dependent) |
| Microsoft Clarity | Free heatmap analytics + recordings at scale | Click, scroll, inferred attention views | Basic insights; not a classic CRO suite | Integrations available (verify list) | Free, forever | Not needed |
| Crazy Egg | Classic click heatmap tool + iterative CRO | Heatmap suite (click/scroll variants) | Limited/depends on package | Verify on vendor page | Tiered plans on pricing page; verify current entry price | Free trial available |
| Mouseflow | Session replay + journey analytics | Heatmaps for pages (click/scroll/move) | Yes | Verify on vendor page | Check pricing page | Check pricing page |
| Smartlook | Modular product analytics with heatmaps | Heatmaps + “page analytics” style views | Yes | Verify on vendor page | Pricing depends on package; check pricing page | Free trial |
| Lucky Orange | All-in-one CRO basics for smaller teams | Click, move, scroll | Some analytics depending on plan | Verify on vendor page | Tiered plans on pricing page; verify based on sessions | Free plan / trial varies |
| Fullstory | Deep debugging + enterprise behavior analytics | Heatmaps / scroll maps / click maps | Yes | Verify on vendor page | Request demo / pricing not fully public | Request demo |
| Contentsquare | Enterprise ecommerce + journey analytics | Heatmaps + zone/journey analysis | Yes | Verify on vendor page | Free plan exists; paid tiers: check pricing page | Check pricing page |
| Zoho PageSense | Affordable CRO suite for SMB teams | Heatmaps + CRO toolset | Yes | Zoho ecosystem + integrations (verify) | Starts from low monthly tiers (verify on pricing page) | 15-day trial |
| Inspectlet | Simple heatmaps + recordings without heavy complexity | Click/move/scroll style overlays | Limited | Verify on vendor page | Check pricing page | Check pricing page |
Want a fast shortcut? If you’re deciding between a website heatmap tool and “just GA,” read this: heatmaps tell you where friction is. Analytics tells you how big the problem is. You need both. If you only pick one, you’ll argue with yourself for weeks.
Top Heatmap Software: Detailed Reviews
Plerdy
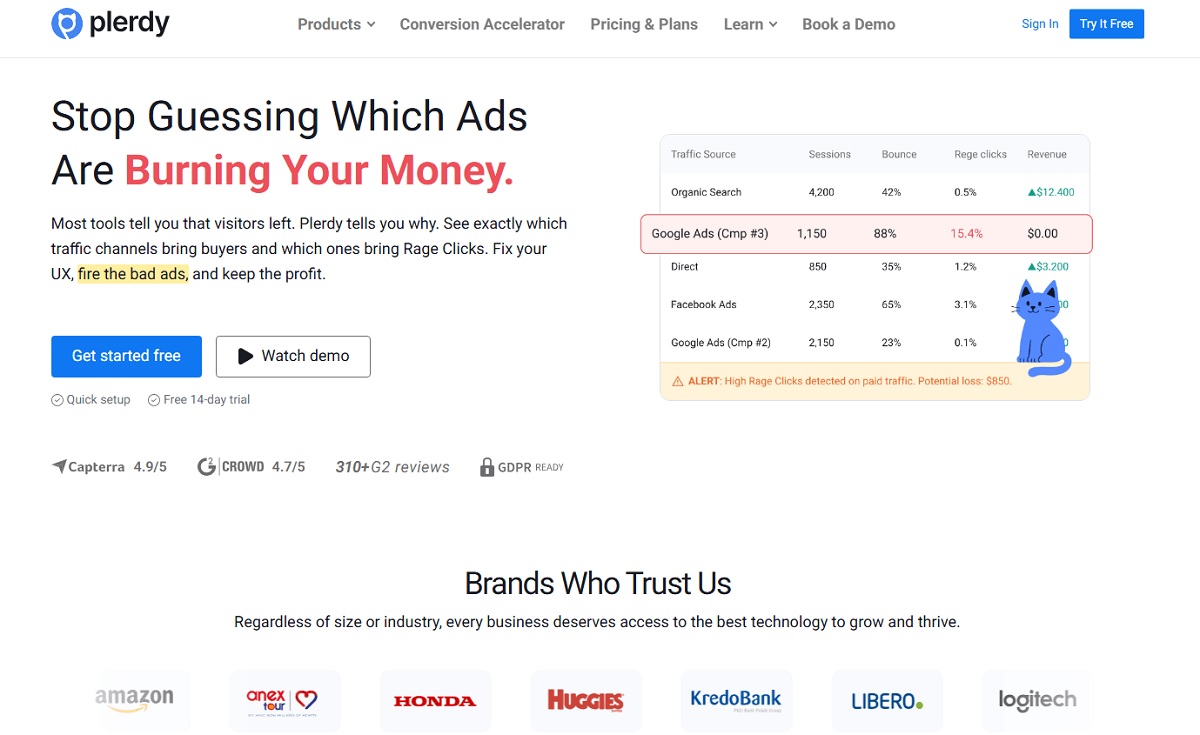
Best for: CRO teams and ecommerce marketers who want top heatmap software plus practical follow-up workflows.
What it’s great at: Turning “interesting heatmap patterns” into a clear list of fixes—especially around navigation, CTAs, and page structure.
Standout heatmap features: Click and scroll insights that help spot dead clicks, hidden CTAs, and high-attention zones that aren’t converting.
Session replay & behavior analytics: Useful when you need the “why.” Heatmaps show where; session recordings show what users tried to do next.
Segmentation & targeting: Practical filtering is what makes heatmap analytics usable. A common workflow is mobile-only analysis and excluding internal traffic so your team doesn’t pollute the data.
Integrations: Verify current integrations and platform support on the vendor site.
Pricing (verified): Paid tiers with a 14-day free trial; verify current limits by plan on the pricing page.
Pros:
- Strong “CRO tool” positioning: not just heatmaps, but behavior context.
- Good fit for ecommerce pages like PDPs, category pages, and checkout steps.
- Encourages action: you can move from insight to test quickly.
Cons:
- You still need a clear goal per page, or the data becomes “interesting noise.”
- Advanced teams may want deeper product analytics in a separate tool.
Who should choose it: If you’re optimizing revenue pages and need a heatmap tool for CRO that supports “ship changes + validate,” Plerdy is a strong fit.
Hotjar
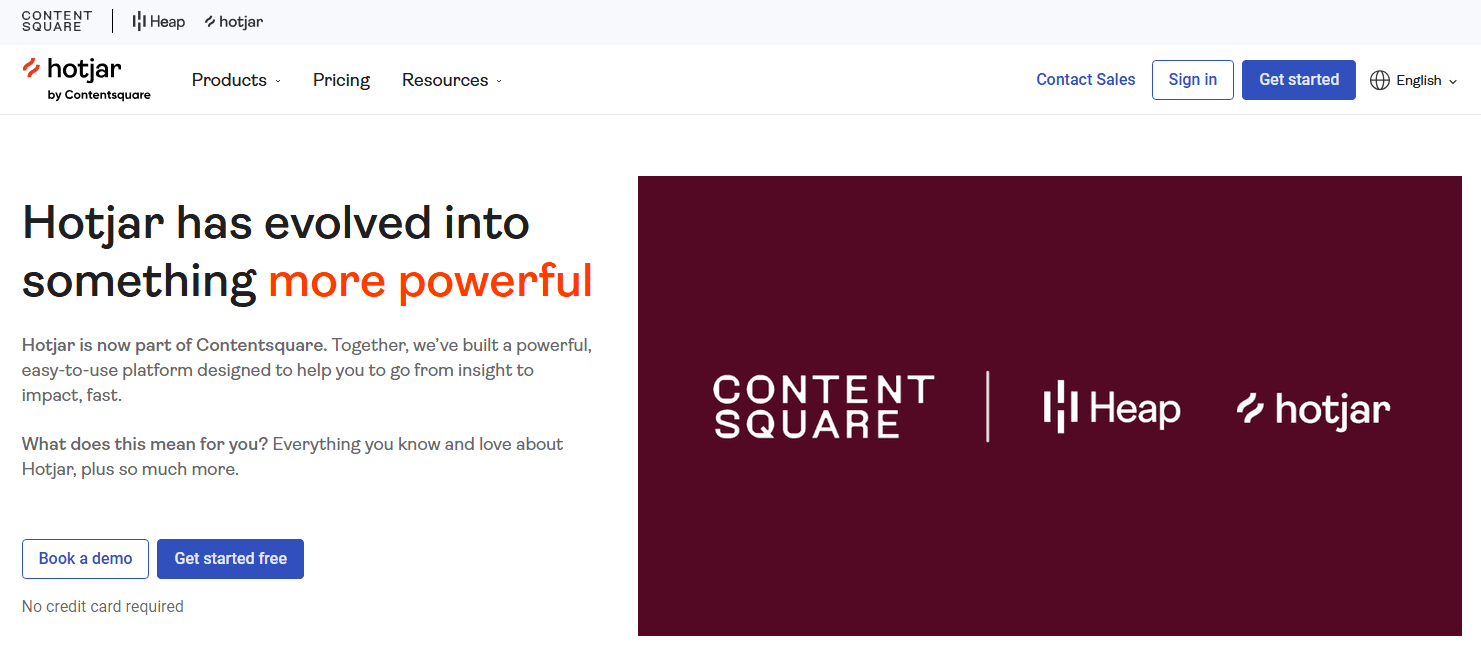
Best for: UX research teams that want heatmap analytics plus feedback tools in the same workflow.
What it’s great at: Pairing a click heatmap tool with surveys/feedback to explain why a section gets ignored or why visitors hesitate.
Standout heatmap features: Easy-to-understand heatmaps, quick setup, and clear visuals for stakeholder sharing.
Session replay & behavior analytics: Recordings are helpful for diagnosing friction, especially when a funnel drop-off doesn’t explain the underlying behavior.
Segmentation & targeting: Filters (device, country, new vs returning) matter here. This is where you compare a weekday vs weekend slice and realize your traffic quality is different.
Integrations: Popular integrations exist (verify the current list on the pricing/integrations pages).
Pricing (verified): Free plan exists; paid tiers vary—verify on pricing page for limits and add-ons.
Pros:
- Great “research loop”: heatmaps + recordings + feedback in one place.
- Friendly UI for non-technical marketers.
- Easy to share insights without drowning people in dashboards.
Cons:
- Advanced funneling/segmentation can be limited compared to enterprise tools.
- At scale, costs/limits can become the deciding factor.
Who should choose it: If your biggest question is “why are users not trusting this page?”, Hotjar’s feedback layer makes heatmaps more actionable.
Microsoft Clarity
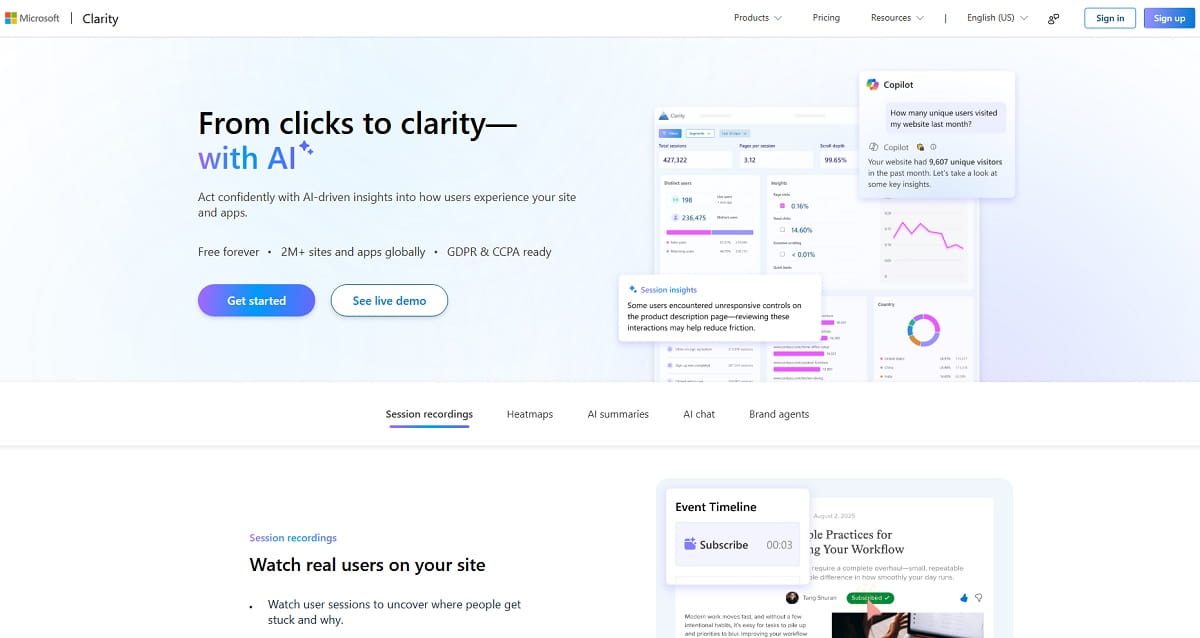
Best for: Anyone who wants a free website heatmap tool with session recordings to find obvious friction fast.
What it’s great at: Rapid “first pass” diagnostics: click heatmap, scroll heatmap, and recordings for common UX failures.
Standout heatmap features: Quick heatmap views and strong friction signals (like rage clicks) that help prioritize what to fix first.
Session replay & behavior analytics: Recordings are the main value—especially when you’re trying to confirm if a UI element is confusing or slow.
Segmentation & targeting: Use filters and segments to avoid mixed conclusions. A classic mistake is blending desktop and mobile behavior into one “average” heatmap.
Integrations: Supports integrations; verify what’s available for your stack.
Pricing (verified): Free, forever (no paid tiers).
Pros:
- Zero cost makes it the easiest entry intoI’s “top heatmap software” option for lean teams.
- Fast setup and quick wins on obvious UX issues.
- Good complement to Google Analytics (behavior view + numbers view).
Cons:
- Not a full CRO suite; you may need separate testing/survey tooling.
- Enterprise governance and deep product analytics can be limited.
Who should choose it: If you’re early in heatmap analytics or need a fast baseline “what’s broken,” Clarity is hard to beat.
Crazy Egg
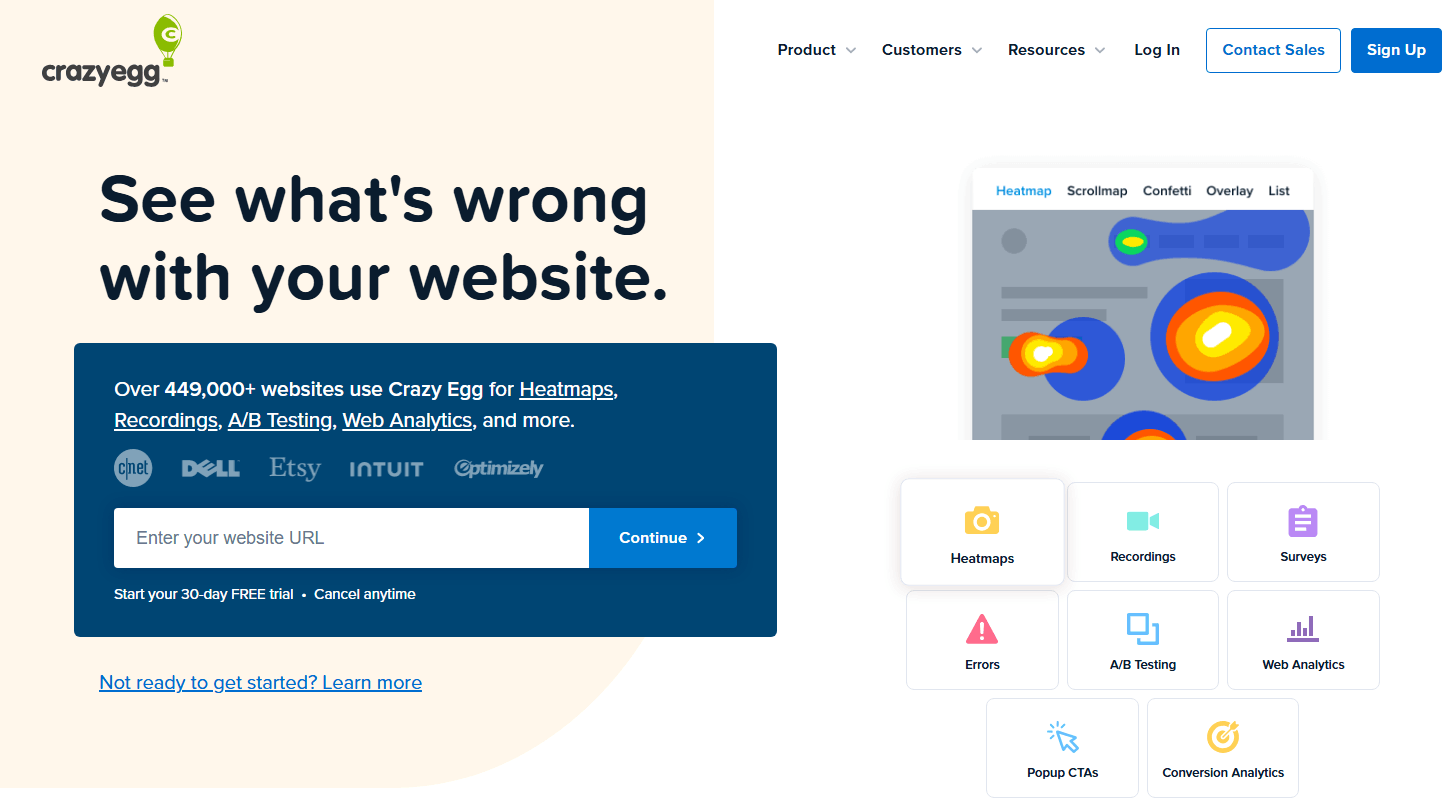
Best for: Teams that want a classic heatmap tool for CRO and a straightforward optimization workflow.
What it’s great at: Turning page behavior into prioritized changes. It’s “old school” in a good way: focused on page-level insights.
Standout heatmap features: A heatmap suite that’s built to compare page variants and identify which blocks attract interaction (or get ignored).
Session replay & behavior analytics: Recordings help you confirm whether a click cluster is meaningful or just confused tapping.
Segmentation & targeting: Focused targeting matters. We often filter “mobile only” and then run a separate pass for returning users, because they behave like a different species.
Integrations: Verify current integrations on the vendor page.
Pricing (verified): Tiered pricing on the official pricing page; verify the entry plan and limits for your traffic.
Pros:
- Strong for landing page optimization and CRO iteration.
- Clear visuals that help speed up stakeholder decisions.
- Works well when you have a “test this first” mindset.
Cons:
- May feel limited if you want deep journeys/product analytics.
- Scaling across many properties can raise costs/complexity.
Who should choose it: If you live in landing pages and want “find friction → change → validate,” Crazy Egg fits the rhythm.
Mouseflow
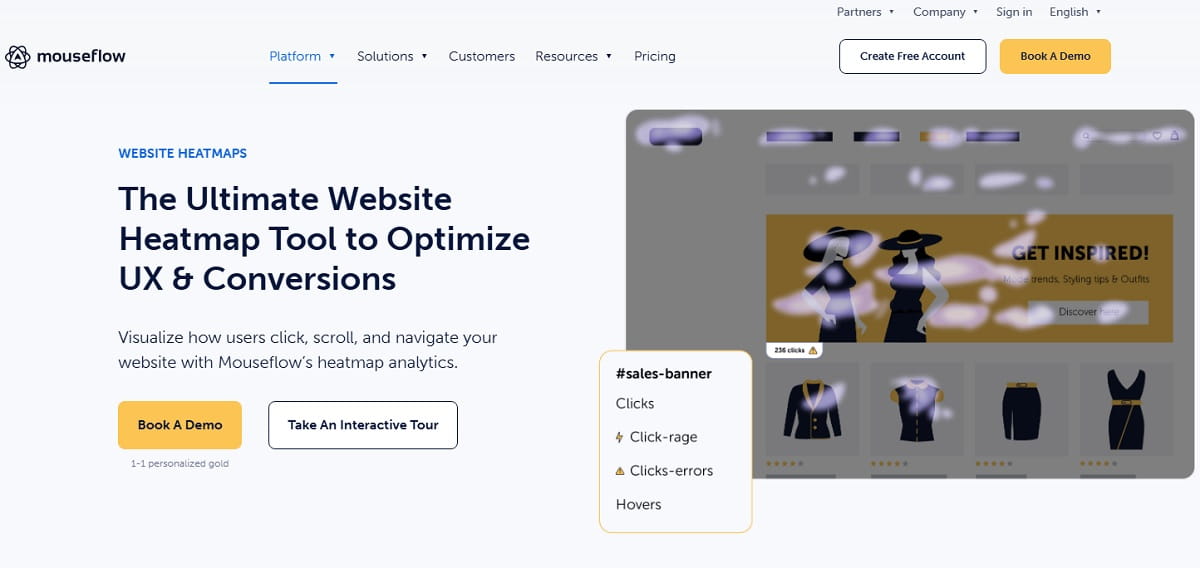
Best for: Teams that want session replay, heatmaps, and journey analytics in an all-in-one style platform.
What it’s great at: Watching user behavior like a movie, then backing it up with heatmap analytics for scale.
Standout heatmap features: Heatmaps for every page, useful when you need both click heatmap and scroll heatmap views across key templates.
Session replay & behavior analytics: Strong replay is the main draw. It’s most valuable when you can tag sessions with events and quickly jump to moments of friction.
Segmentation & targeting: The difference between “nice tool” and “daily driver” is filters. Exclude internal traffic, filter to paid campaigns, and compare high-intent pages only.
Integrations: Verify on the vendor page and check your analytics stack compatibility.
Pricing (verified): Check pricing page (plans and limits vary).
Pros:
- Good blend of heatmaps + recordings + journey style analysis.
- Helpful for diagnosing multi-step paths, not just single pages.
- Works well for teams that want one platform for behavior analytics.
Cons:
- Plan limits and retention can change the real cost quickly.
- Setup discipline is required (otherwise you drown in sessions).
Who should choose it: If your questions are “how do people move through the site?” not just “where do they click?”, Mouseflow is worth a look.
Smartlook
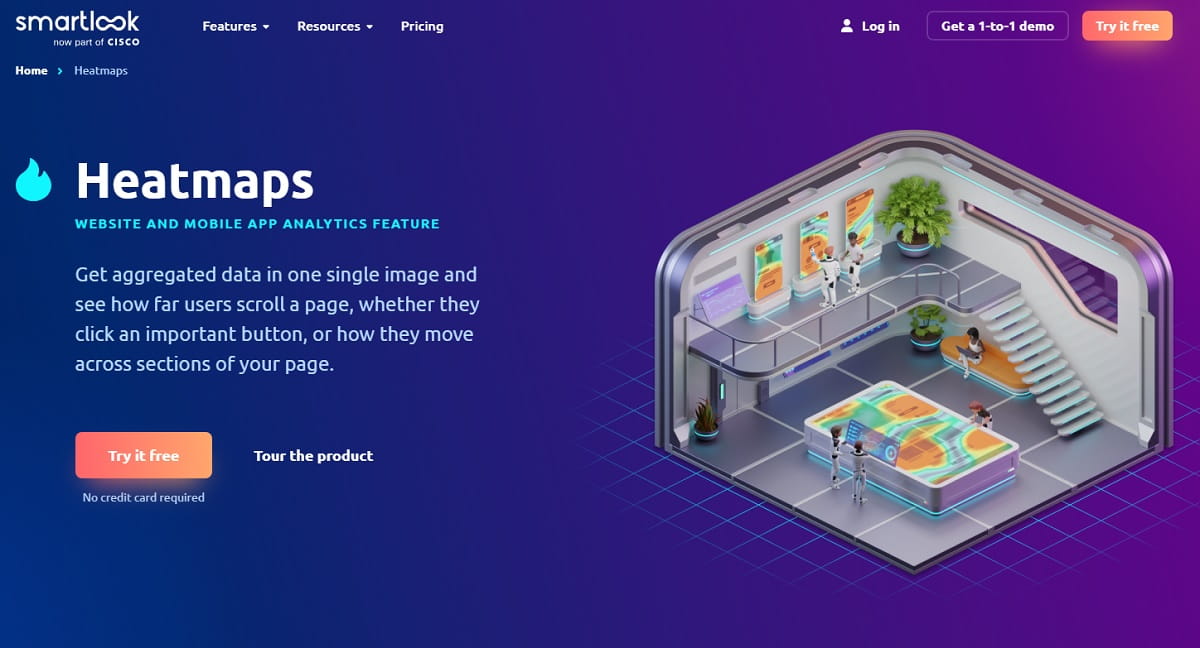
Best for: Teams that want modular behavior analytics (recordings, events, funnels) plus heatmaps.
What it’s great at: Combining heatmap software with product analytics style thinking—especially if you care about events and funnels, not just page clicks.
Standout heatmap features: Heatmaps and “page analytics” style views that can be surfaced directly from session recordings (useful when you don’t want to wait around for separate reports).
Session replay & behavior analytics: Recordings are central, with the ability to inspect user behavior and tie it to events.
Segmentation & targeting: The micro-detail that saves time: tag your key pages (checkout, PDP, lead form) and filter to those first. Otherwise you’ll review sessions from blog posts all day.
Integrations: Verify on vendor page.
Pricing (verified): Free trial available; pricing depends on chosen package—verify on pricing page.
Pros:
- Good for teams that care about events and funnels alongside heatmaps.
- Helpful “jump from replay to insight” workflow.
- Works across web and (depending on plan) mobile analytics needs.
Cons:
- Costs can depend heavily on volume and feature selection.
- May require more setup discipline than simpler heatmap tools.
Who should choose it: If your CRO work includes event-based diagnosis and funnel thinking, Smartlook can feel more “analytic” than typical heatmap-only tools.
Lucky Orange
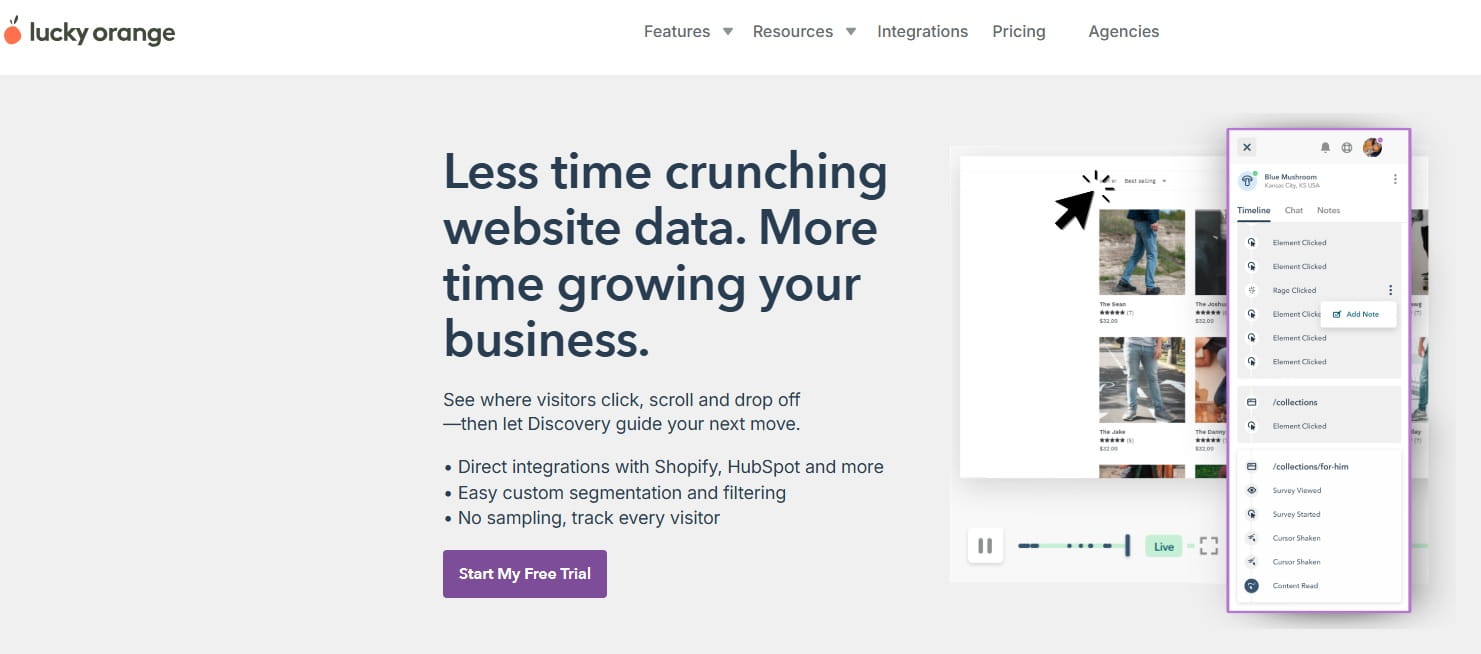
Best for: Smaller teams who want heatmaps, recordings, and extra CRO helpers without building a complex stack.
What it’s great at: Getting to useful insights quickly. It’s the type of tool you can hand to a marketer and get action within a day.
Standout heatmap features: Click heatmap, scroll heatmap, and movement views that help you see what gets attention and what gets skipped.
Session replay & behavior analytics: Recordings are where the “aha” moments happen—especially for form friction and checkout confusion.
Segmentation & targeting: Don’t treat it like a surveillance camera. Filter to high-intent traffic, and compare segments (new vs returning, mobile vs desktop). That one step prevents bad conclusions.
Integrations: Verify current integrations and ecommerce platform support on the vendor site.
Pricing (verified): Tiered plans shown on pricing page; verify based on session caps and retention.
Pros:
- Fast time-to-value for basic heatmap analytics.
- Good fit for ecommerce stores that need quick CRO wins.
- Often includes additional CRO features beyond heatmaps.
Cons:
- Advanced enterprise governance may be limited.
- High-volume sites may outgrow plan caps quickly.
Who should choose it: If you want a solid “best heatmap software” contender for a lean team and you’re focused on practical fixes, Lucky Orange is a strong candidate.
Fullstory
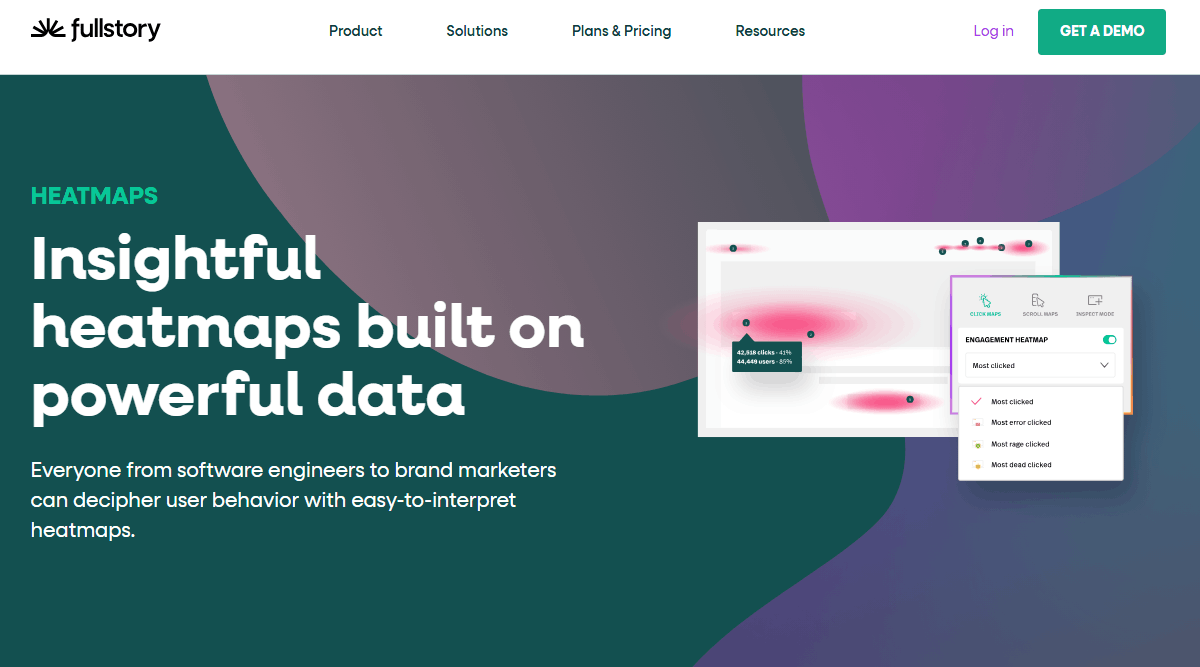
Best for: Teams that need deep session replay diagnostics and enterprise-grade user behavior analytics.
What it’s great at: Finding the “why” behind conversion drops with replay depth and strong analysis tooling—especially for complex flows and product experiences.
Standout heatmap features: Heatmaps / click maps / scroll maps that help summarize patterns, then jump into replay for context.
Session replay & behavior analytics: A major strength. This is where engineering and product teams often align with CRO, because the data helps locate friction and errors.
Segmentation & targeting: Segmentation becomes essential. Filter by device, page state, and key events. Also: compare “before vs after” when you ship changes, not just “this month vs last month.”
Integrations: Verify on vendor page (typically strong ecosystem support).
Pricing (verified): Plans are listed, but pricing is not fully public; request a demo / verify plan details.
Pros:
- Excellent diagnostic depth for replay and behavior analysis.
- Strong for teams who need more than surface-level heatmaps.
- Helpful for product-led orgs and complex multi-step journeys.
Cons:
- Not the cheapest path; often enterprise budget territory.
- Overkill if you only need basic click heatmap + scroll heatmap.
Who should choose it: If you routinely debug complicated journeys and need reliable replay + analysis, Fullstory is a serious contender.
Contentsquare
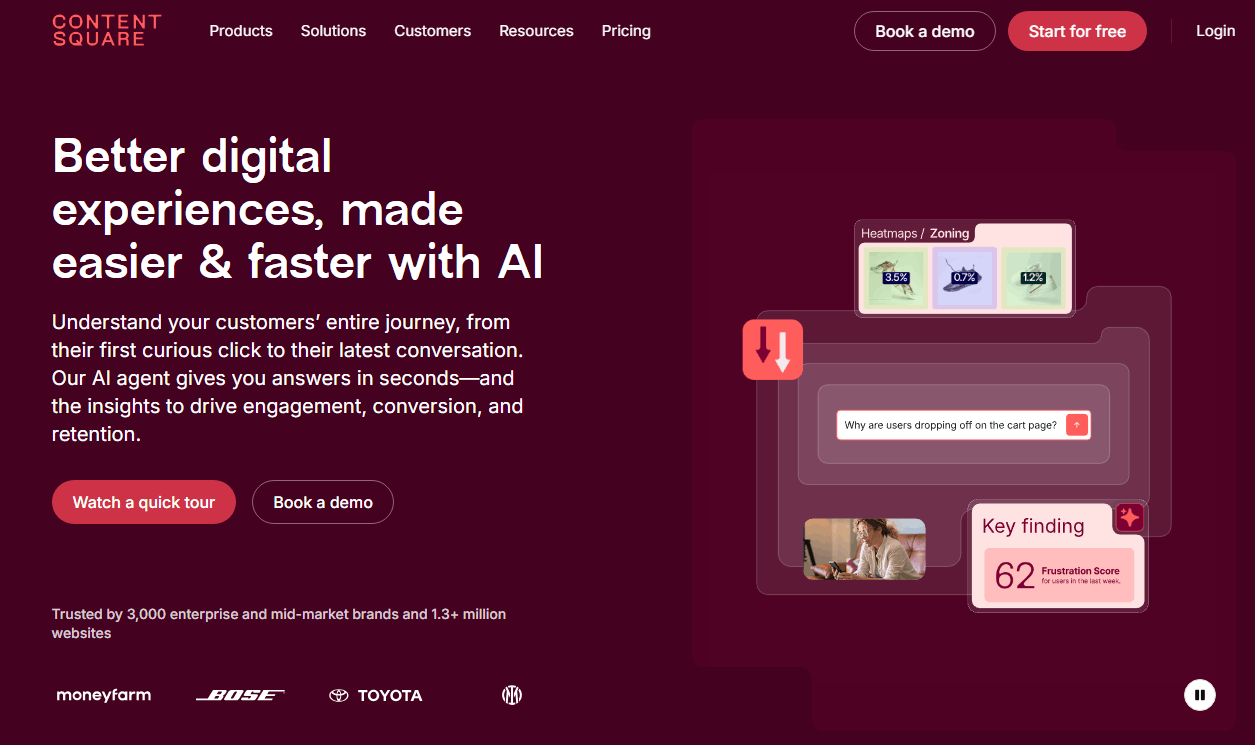
Best for: Enterprise ecommerce and product teams that need advanced journey analysis plus heatmap software.
What it’s great at: Connecting heatmap analytics to broader experience analytics: journeys, zones, and “where do customers actually get stuck?”
Standout heatmap features: Heatmaps plus zone-based analysis. It’s built for teams that want structured insight, not just a colorful overlay.
Session replay & behavior analytics: Session replay exists and is designed to connect to other capabilities, so teams can move from aggregate pattern to real-session context.
Segmentation & targeting: This is where enterprise tools shine—segment by visitor type, page groups, and behavioral cohorts. One micro-detail: isolate checkout vs PDP behavior, because mixing them ruins prioritization.
Integrations: Verify on vendor page and confirm your stack requirements.
Pricing (verified): Pricing page indicates tiered plans and/or free plan; verify limits and paid pricing on the official pricing page.
Pros:
- Strong for enterprise-grade ecommerce behavior analysis.
- Good linkage between heatmaps, journeys, and replay.
- Designed for cross-team usage (product, UX, analytics).
Cons:
- May be too heavy for small teams.
- Implementation and governance can require more coordination.
Who should choose it: If you run ecommerce at scale and need structured experience analytics beyond basic heatmaps, Contentsquare is worth evaluating.
Zoho PageSense
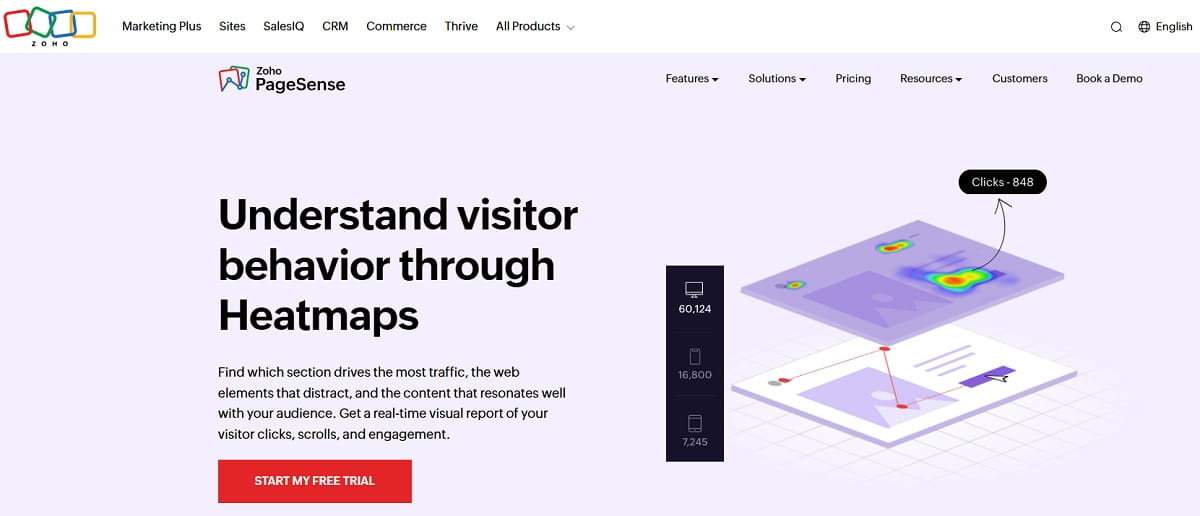
Best for: SMB teams that want a cost-aware CRO suite with heatmaps, recordings, and funnels.
What it’s great at: Covering the basics well—heatmap analytics, session recordings, funnel analysis—without forcing you into enterprise contracts.
Standout heatmap features: Heatmaps integrated into a broader CRO toolkit, so insights can connect to experiments and page improvements.
Session replay & behavior analytics: Recordings help you validate what heatmaps suggest. This is useful for “why is this form abandoned?” investigations.
Segmentation & targeting: Targeting is where you save money and time: select key projects/pages and avoid capturing low-intent pages that dilute your conclusions.
Integrations: Works well in the Zoho ecosystem; verify integrations and external compatibility on the vendor page.
Pricing (verified): Pricing is published; entry tiers start at low monthly rates depending on visitor volume—verify current tiers on the pricing page.
Pros:
- Good value for teams that want more than a standalone heatmap tool.
- Balanced CRO feature set: heatmaps, funnels, recordings.
- Useful for both lead-gen and ecommerce pages.
Cons:
- May not match enterprise tools on advanced analysis depth.
- Some teams prefer more specialized UI for dedicated heatmap tools.
Who should choose it: If you want a practical “heatmap software for ecommerce” and lead-gen without enterprise overhead, PageSense is a strong shortlist option.
Inspectlet
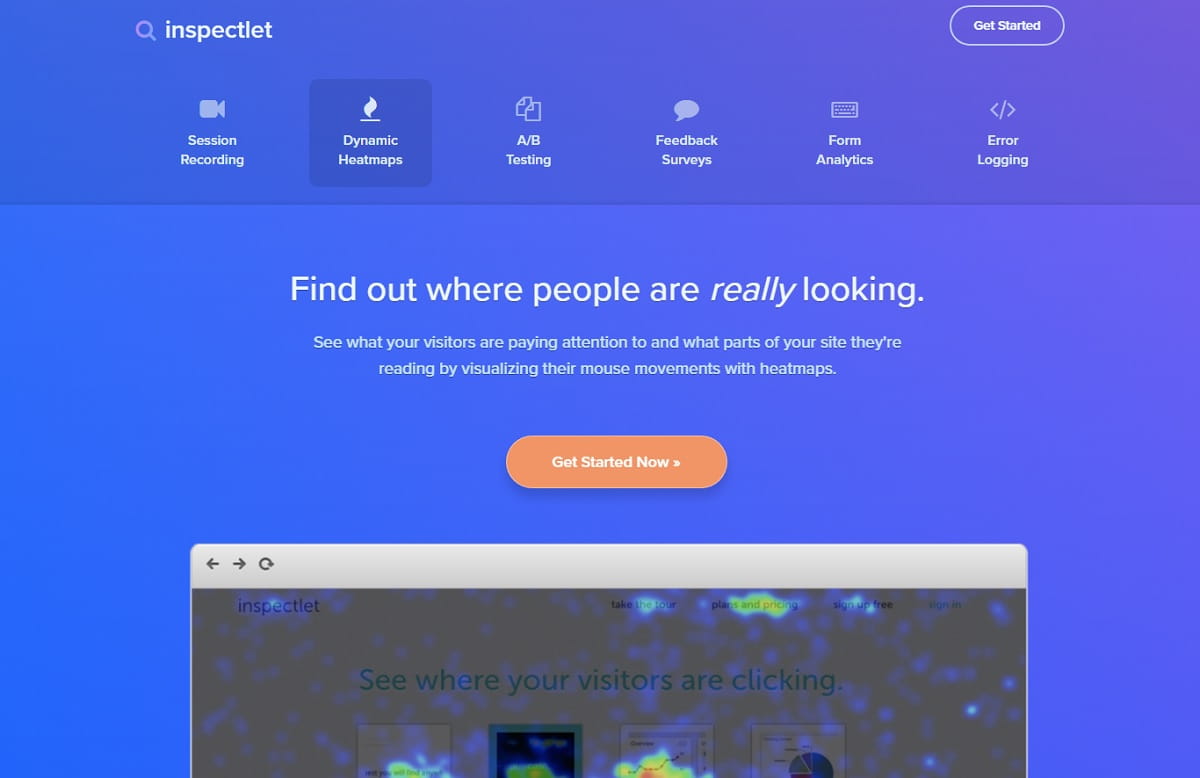
Best for: Teams that want straightforward recordings + heatmaps without a huge learning curve.
What it’s great at: Seeing the exact sequence of actions users take on a page, then using heatmaps to confirm patterns at scale.
Standout heatmap features: Classic heatmap overlays (click/move/scroll style) to highlight interaction areas.
Session replay & behavior analytics: Session recording is central here. It’s especially helpful for “why does this dropdown break on mobile?” style debugging.
Segmentation & targeting: Keep it simple: segment by device, exclude internal traffic, and don’t mix campaign traffic with organic if you’re diagnosing conversion intent.
Integrations: Verify on vendor page (and confirm whether your stack needs server-side event wiring).
Pricing (verified): Published plan structure exists; verify current tiers on pricing page.
Pros:
- Strong “watch what happened” value from recordings.
- Heatmaps support quick page-level prioritization.
- Good fit for smaller teams and focused CRO tasks.
Cons:
- May lack advanced journey analytics compared to enterprise suites.
- Workflow and collaboration features can be lighter than newer platforms.
Who should choose it: If you want a reliable click heatmap tool + recordings and prefer a simpler setup, Inspectlet is worth considering.
Plerdy Heatmaps: Practical Use Case For CRO Teams
Let’s make this concrete, because “heatmaps are helpful” is not a strategy.
Imagine a paid landing page that gets steady traffic, but conversions are flat. We open Plerdy Heatmaps and start with two quick passes: desktop vs mobile. On desktop, clicks cluster where we expect. On mobile, something weird happens: the scroll heatmap drops sharply right after the hero, and there’s a dense pocket of dead clicks on a “trusted by” logo strip that looks like a carousel… but it isn’t.
Now the “next actions” list is obvious:
- Fix the fake affordance: Make the logo strip either clickable (real carousel) or visually static. Dead clicks are confused intent.
- Move or duplicate the CTA earlier: If 60–70% of mobile visitors never reach your CTA block, it’s not “low intent.” It’s placement.
- Simplify the first screen: Reduce cognitive load. Tighten the hero copy. Make the primary CTA a single, clear choice.
- Check sticky elements: A sticky bar can cover tap targets and cause rage clicks. This happens more than teams want to admit.
- Validate with recordings: Session recordings confirm whether people hesitate due to load, confusion, or form friction.
Then you do the boring-but-profitable part: ship changes, run heatmap analytics again, and verify impact through a goal metric (form submits, add-to-cart, checkout progression). This is not a redesign. It’s controlled improvement. If you need a broader foundation, link internally: Conversion Rate Optimization Guide.
One micro-detail that saves weeks: compare a weekday slice vs weekend slice. If weekend traffic is colder, your heatmap patterns can look “worse” even if the UX is fine. Segment first, then judge the page.
How To Choose The Best Heatmap Software
Picking the best heatmap software isn’t about the prettiest rainbow overlay. It’s about whether you can reliably turn behavior into decisions. Use these decision factors:
- Traffic level and sampling: If you have low traffic, you need tools that let you run longer and avoid aggressive sampling. Otherwise patterns flip daily.
- Page focus vs site-wide analysis: Some tools shine on specific landing pages. Others are built for journeys and templates across large sites.
- Session recordings quality: Heatmaps show where people click. Recordings show what broke their flow. If your team diagnoses friction weekly, prioritize replay quality.
- Segmentation depth: At minimum: mobile vs desktop, new vs returning, and campaign vs non-campaign. Without this, heatmap analytics becomes a guessing game.
- Funnels and goals: If you run ecommerce, you want funnel steps (PDP → cart → checkout → purchase). If you run lead gen, you want form drop-offs and micro-conversions.
- Privacy + compliance: Make sure masking/consent controls match your region and risk tolerance. Don’t assume “GDPR compliant” means the same thing in every setup.
- Collaboration and sharing: Can you send a link to an insight and have someone understand it in 2 minutes?
- Price-to-value: Compare what you actually need: recordings volume, retention length, and key features. The “cheap” plan is expensive when you hit caps mid-month.
If you have low traffic: pick a website heatmap tool that lets you focus on 1–3 key pages, run longer, and segment cleanly. Also: don’t overfit. A handful of sessions won’t answer strategic questions.
If you run ecommerce: prioritize scroll heatmap + recordings for PDP and checkout. You’ll find friction in shipping visibility, form fields, and “what happens after I click?” moments. That’s where revenue lives.
Implementation Checklist: Set Up Heatmaps The Right Way
Heatmaps can be wildly useful—or wildly misleading—depending on setup. Here’s the checklist teams should follow before declaring “the CTA doesn’t work.”
- Pick the pages that print money: pricing, checkout, PDPs, lead forms, top landing pages. Start small.
- Define the goal per page: purchase, add-to-cart, form submit, demo request, click-to-pricing. One page, one primary goal.
- Exclude internal and bot traffic: Your team clicking around will poison the click heatmap tool results. Do this on day one.
- Segment immediately: at least mobile vs desktop. Add new vs returning if you can. Don’t mix behaviors.
- Run long enough for stable patterns: If patterns change every day, you don’t have enough data or you’re mixing segments.
- Compare a “before vs after” slice: Ship a change, then measure again. That’s how you avoid “we saw a hot spot, so we redesigned everything.”
- Pair heatmaps with recordings: When you see dead clicks or rage clicks, recordings explain whether it’s confusion, slow UI, or a broken element.
- Turn insights into tests: Move CTA, shorten the page, reorder blocks, simplify forms. Then validate. Rinse and repeat.
Common mistakes (that waste time):
- Running heatmaps on 20 pages at once, then never reviewing them.
- Using one blended heatmap for mobile + desktop, then making “average user” decisions.
- Chasing tiny UI tweaks on low-traffic pages while checkout bleeds revenue.
- Not aligning with dev/product on approvals—because when approvals take a week, the sprint slows down.
External reading placeholders (use reputable sources): G2 Heatmap Software Category | Capterra Heatmap Tools | TrustRadius Visitor Behavior Analytics
FAQ
What is the best heatmap software?
The best heatmap software depends on your team and traffic. If you need a free starting point, Microsoft Clarity is strong. If you need a fuller CRO workflow, look at tools that combine heatmap analytics with session recordings, segmentation, and funnels—then pick based on your primary pages (checkout, PDPs, forms).
Are heatmaps accurate?
Heatmaps are accurate for showing patterns, but they’re not mind-reading. Click heatmaps are usually the most reliable. “Attention” heatmaps are often inferred, so treat them as directional. The safest workflow is heatmaps to find the “where,” then session recordings to confirm the “why.”
How long should I run heatmaps?
Run them until patterns stabilize. High-traffic pages may show clear patterns quickly, while low-traffic pages need longer. A practical method: compare two time slices (e.g., first half vs second half of the period). If the story stays consistent, you’ve likely collected enough data.
Do heatmaps slow down a site?
Most heatmap tools are designed to be lightweight, but any script can add some overhead. The real risk is misconfiguration, too many tags, or loading scripts poorly. Use the vendor’s recommended implementation, monitor performance, and avoid stacking multiple replay tools at once.
Heatmaps vs Google Analytics?
Google Analytics explains what happened (drop-offs, conversion rate, sources). Heatmaps explain where people interacted or got stuck. They work best together: analytics tells you which page is losing money, and a website heatmap tool shows what’s confusing on that page.
Is heatmap software GDPR compliant?
Many vendors offer GDPR-friendly features like masking and consent support, but compliance depends on your setup. Confirm data retention, anonymization, and consent requirements with your legal/analytics policies. If you operate in strict regions, prioritize tools with clear privacy controls and documentation.
What pages should I track first for CRO?
Start with your highest-intent, highest-traffic steps: pricing pages, product pages, cart/checkout, and lead forms. Most wins come from those steps. Heatmap analytics on low-intent pages can be interesting, but it rarely moves revenue fast.
What’s a “dead click” and why does it matter?
A dead click is when users click something that doesn’t respond—often because it looks clickable. Dead clicks signal confusion and wasted intent. Fixing them can produce quick CRO wins: make the element work, clarify the UI, or remove misleading styling that invites clicks.
Conclusion
Choosing top heatmap software comes down to one question: will this tool help you ship better decisions, faster? Start with your money pages, segment the data, and pair a click heatmap tool with session recordings so you don’t guess. If you’re running ecommerce, prioritize checkout and PDP behavior first. Then do the simplest thing that could work: make a change, validate it, repeat. That’s how heatmap analytics turns into real conversion lift—without turning your CRO process into a never-ending dashboard tour.