

Sales analytics software turns scattered activity, pipeline, customer, and revenue data into decisions a team can act on. The right platform can show why deals stall, which channels produce valuable customers, whether a forecast is credible, and where revenue is leaking. The wrong one adds another dashboard that people open once and ignore.
Plerdy approaches sales analytics from the website side: it connects purchases with traffic sources, pages, products, clicks, and on-page interactions that happened before an order. That makes it especially useful for ecommerce and conversion teams. CRM-native platforms such as Salesforce and HubSpot are stronger for opportunity management, while Gong and Clari specialize in conversation and revenue intelligence. This guide compares those different categories instead of pretending that every sales analytics tool solves the same problem.
Quick answer: Plerdy is the best choice for website and ecommerce sales behavior, Salesforce is the strongest enterprise CRM option, HubSpot is a practical all-in-one choice for growing teams, Gong is best for conversation intelligence, Clari is built for enterprise forecasting, and Power BI is the most flexible option for Microsoft-centered reporting.
What Is Sales Analytics Software?
Sales analytics software collects, organizes, visualizes, and interprets data related to leads, opportunities, transactions, sales activities, customers, and revenue. Unlike basic sales reporting software, which mainly summarizes past results, a modern sales analytics platform helps teams understand what happened, why it happened, what is likely to happen next, and which action deserves priority.
The category is broader than a single product type. G2 defines sales analytics software mainly around pipeline visualization, performance reporting, scoring, and forecasting. That definition works well for B2B sales teams, but ecommerce businesses also need to understand product sales, average order value, conversion paths, traffic profitability, and website behavior. As Shopify explains in its sales analytics guide, useful sales analysis can include sales volume, average order value, sell-through rate, conversion rates, and customer behavior.
Four Types Of Sales Analytics Software
- CRM Analytics: Measures leads, opportunities, stages, win rates, rep activity, and pipeline health. This form of sales performance analytics is available in Salesforce, HubSpot, Pipedrive, and Close.
- Revenue Intelligence: Analyzes calls, emails, deal risk, forecast changes, and buying signals. Gong and Clari are leading examples.
- Business Intelligence: Combines CRM, finance, marketing, product, and operational data in customizable dashboards. Power BI, Tableau, Looker, Qlik, and Zoho Analytics fit here.
- Website And Ecommerce Sales Analytics: Connects transactions with products, pages, traffic sources, funnels, and user interactions. Plerdy fits this use case.
This distinction matters. A sales manager who needs quota and pipeline forecasting should not buy a heatmap platform as a CRM replacement. An ecommerce manager who wants to know why product-page traffic does not become revenue should not expect a pipeline dashboard to reveal ignored CTAs, weak page depth, or checkout friction.
Best Sales Analytics Software Compared
| Software | Best For | Primary Analytics Strength | Pricing Approach | Main Limitation |
|---|---|---|---|---|
| Plerdy | Ecommerce And Website Teams | Revenue Influence Of Pages And Elements | Free Plan; Paid Plans Available | Not a CRM Or Pipeline Forecasting System |
| Salesforce | Enterprise Sales Organizations | CRM, Pipeline, Forecasting, And AI | Per-User Subscription | High Setup And Administration Cost |
| HubSpot Sales Hub | Growing Sales And Marketing Teams | Unified CRM And Revenue Reporting | Free Tools And Paid Tiers | Advanced Features Can Become Expensive |
| Gong | Conversation-Driven B2B Sales | Call, Email, Deal, And Coaching Intelligence | Custom Quote | Requires Consistent Communication Data |
| Clari | Enterprise Revenue Operations | Forecasting And Pipeline Inspection | Custom Quote | Too Complex For Many Small Teams |
| Pipedrive | Small And Mid-Sized Sales Teams | Visual Pipeline And Activity Reporting | Per-User Subscription | Less Flexible Than Enterprise BI |
| Zoho Analytics | Affordable Cross-Source BI | Data Blending And Self-Service Dashboards | Free And Paid Plans | Data Modeling Takes Preparation |
| Microsoft Power BI | Microsoft-Centered Organizations | Flexible BI And Data Modeling | Free Desktop And Paid Cloud Plans | Advanced Models Need BI Skills |
| Tableau | Advanced Visual Analysis | Interactive Dashboards And Exploration | Role-Based Subscription | Governance And Licensing Need Planning |
| Looker | Data-Warehouse-Centered Teams | Governed Metrics And Embedded Analytics | Custom Quote | Requires Technical Modeling |
| Qlik Cloud Analytics | Complex Multi-Source Analysis | Associative Data Exploration | Tiered Subscription | Steeper Learning Curve |
| Close | High-Velocity SMB Sales Teams | CRM Activity And Pipeline Reporting | Subscription With Trial | Less Suitable For Complex Enterprises |
Pricing and packaging change frequently. Confirm current limits, required add-ons, onboarding fees, and annual billing conditions on each vendor’s official website before purchasing.
How We Evaluated Sales Analytics Tools
We did not rank platforms by the number of dashboard widgets. Each product was evaluated against the job its target customer actually needs to complete.
- Data Coverage: CRM records, transactions, calls, emails, website behavior, product data, or external business sources.
- Decision Quality: Whether reports reveal a useful next action instead of only describing historical performance.
- Forecasting And Diagnostics: Ability to predict outcomes or explain why performance changed.
- Integrations: Connections with CRM, ecommerce, advertising, finance, communication, and data warehouse systems.
- Usability: Setup effort, dashboard clarity, filtering, segmentation, and accessibility for non-analysts.
- Governance: Permissions, metric consistency, privacy, security, and auditability.
- Value: Whether the platform’s depth is appropriate for the team, data volume, and decisions it supports.
A tool received a stronger position when its advantage was clear and defensible for a specific use case. There is no credible universal winner among sales analytics tools: pipeline forecasting, conversation coaching, business intelligence, and website conversion analysis are different jobs.
Best Sales Analytics Software Reviews
1. Plerdy — Best For Website And Ecommerce Sales Analytics
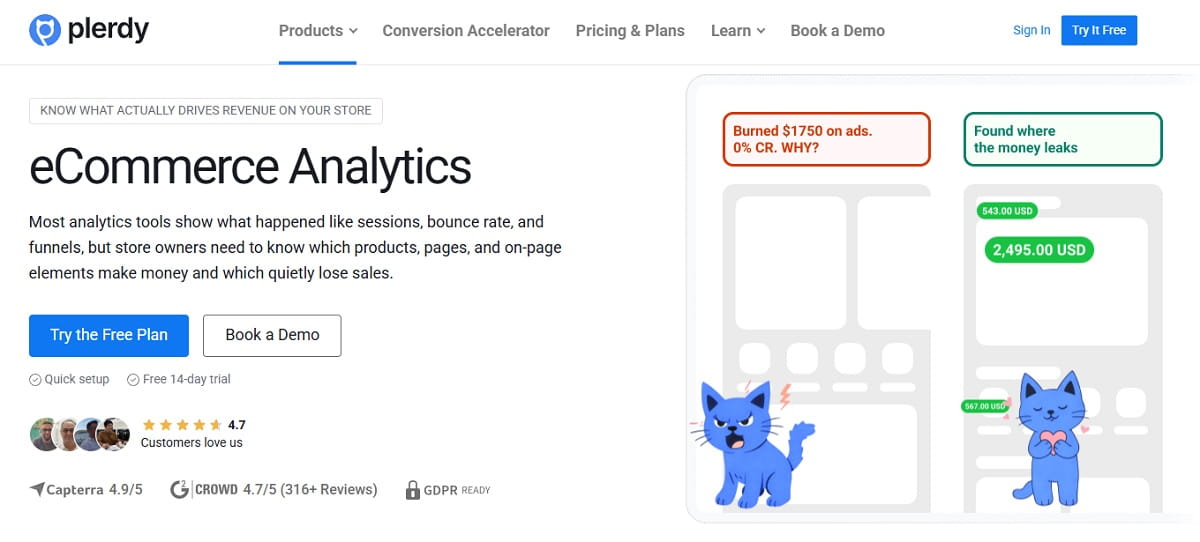
Plerdy Ecommerce Analytics helps online businesses connect revenue with the website experience that preceded it. Standard sales reports can show that revenue fell. Plerdy helps investigate whether the change is associated with a traffic source, product, page, navigation path, page depth, or clickable element.
Reports include sales over time, transactions, conversion rate, average order value, purchased products, profitable pages, customer acquisition sources, basket insights, navigation paths, and the revenue influence of website elements. Teams can combine those reports with heatmaps, session recordings, funnels, event tracking, A/B testing, and website feedback.
Best For: Ecommerce managers, CRO specialists, website owners, performance marketers, and UX teams that need to understand what on the website supports or suppresses sales.
Why It Stands Out: It adds behavioral context to revenue. A CRM can show a closed opportunity, while Plerdy can show that buyers repeatedly interacted with a product comparison, stopped at a particular page depth, or followed a specific navigation path before ordering.
Limitations: Plerdy is not designed to replace a CRM for account management, rep quotas, B2B opportunity stages, or enterprise sales forecasting. Use it alongside a CRM or ecommerce platform when both pipeline and on-site behavior matter.
2. Salesforce — Best For Enterprise CRM Analytics
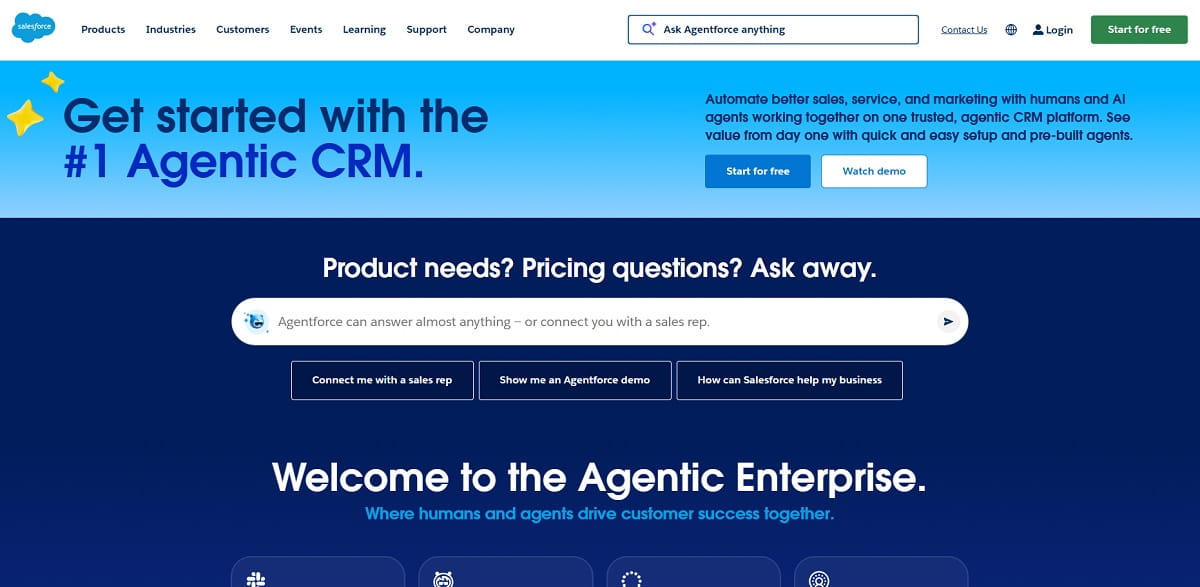
Salesforce Agentforce Sales, formerly Sales Cloud, combines lead, account, opportunity, pipeline, forecast, activity, and performance data in one CRM ecosystem. Its official product documentation highlights customizable dashboards, forecast management, pipeline tracking, AI-assisted prioritization, and deal insights.
Best For: Large or complex sales organizations that need a configurable system of record with extensive automation, permissions, integrations, and reporting.
Why It Stands Out: Salesforce can support highly customized sales processes, territories, approval flows, account structures, and forecasting models. It is also supported by a large partner and application ecosystem.
Limitations: Flexibility creates implementation cost. Data quality, object design, governance, and administrator capacity matter as much as the software license. Small teams may pay for complexity they cannot use.
3. HubSpot Sales Hub — Best For Growing Revenue Teams
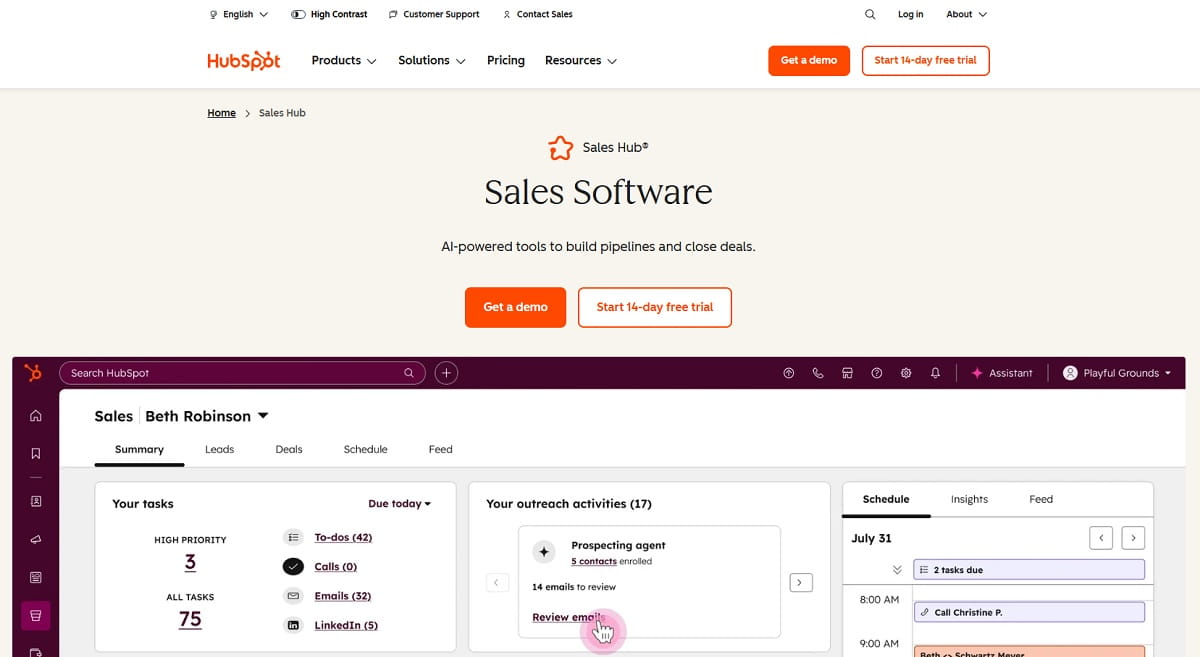
HubSpot Sales Hub places sales analytics inside a broader customer platform covering CRM, marketing, service, content, data, and revenue operations. This makes it useful when a growing company wants one customer record across acquisition, sales, and retention.
Best For: Startups, SMBs, and mid-market teams that value fast adoption and alignment between marketing and sales.
Why It Stands Out: HubSpot provides free entry-level tools and a relatively approachable interface. Paid tiers expand forecasting, custom reporting, sequences, automation, coaching, and team management.
Limitations: The total cost can rise as the database, seat count, automation needs, and reporting requirements grow. Confirm which analytics features belong to each hub and tier before migrating.
4. Gong — Best For Conversation Intelligence
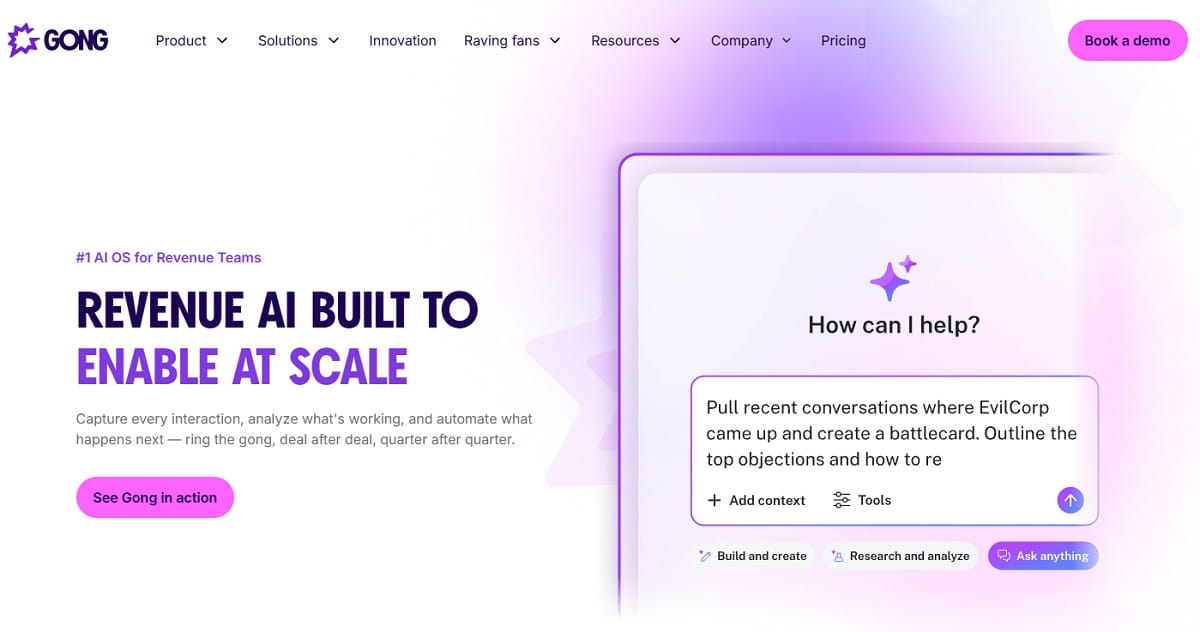
Gong analyzes sales conversations and related deal activity to reveal customer signals, objections, risks, topics, and coaching opportunities. It is strongest where calls, meetings, and emails contain information that ordinary CRM fields fail to capture.
Best For: B2B sales teams with a meaningful volume of recorded customer conversations and managers who want evidence-based coaching.
Why It Stands Out: Gong can help teams inspect what buyers actually say, compare winning and losing patterns, and identify deals that look healthy in CRM but show risk in recent interactions.
Limitations: Its value depends on communication coverage, recording policies, integrations, and user adoption. It is not the first tool to buy when the basic CRM process and opportunity data are still unreliable.
5. Clari — Best For Enterprise Revenue Forecasting
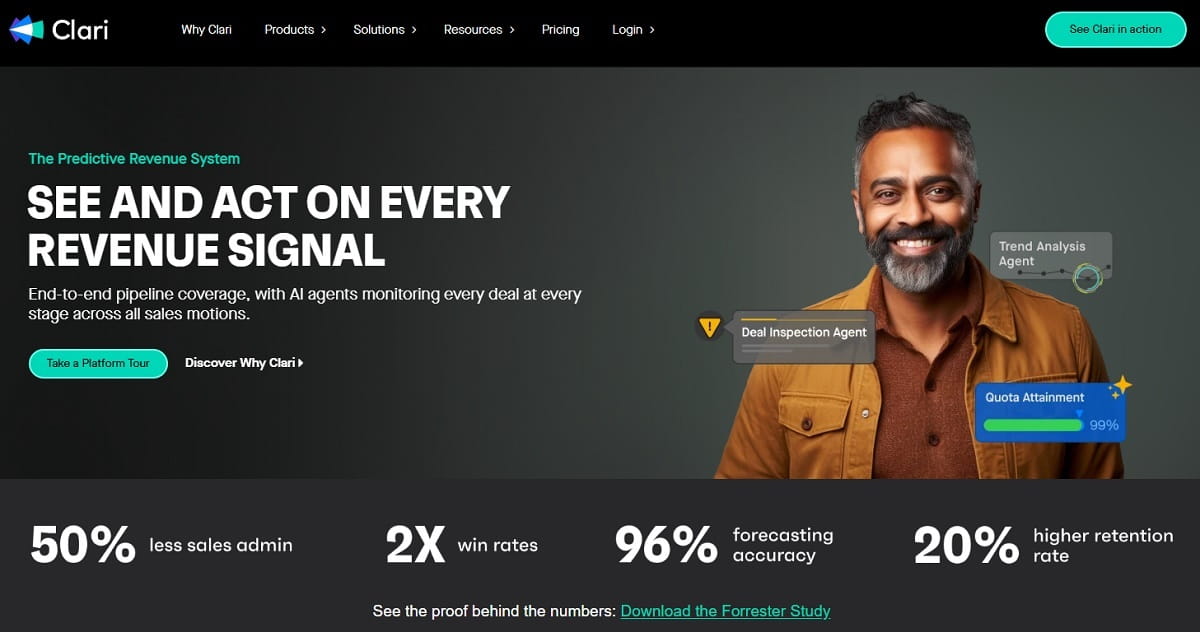
Clari focuses on revenue orchestration, forecast inspection, pipeline visibility, and deal execution. It is designed for revenue leaders who need dedicated sales forecasting software and a consistent operating view across teams, periods, and systems.
Best For: Enterprise RevOps organizations with formal forecasting cadences and complex pipelines.
Why It Stands Out: Clari emphasizes changes in pipeline, forecast confidence, deal risk, and execution. It can help replace spreadsheet-based forecast calls with a shared system.
Limitations: Smaller companies may not have the process maturity, data volume, or operational resources needed to justify an enterprise revenue platform.
6. Pipedrive — Best For Visual Pipeline Analytics
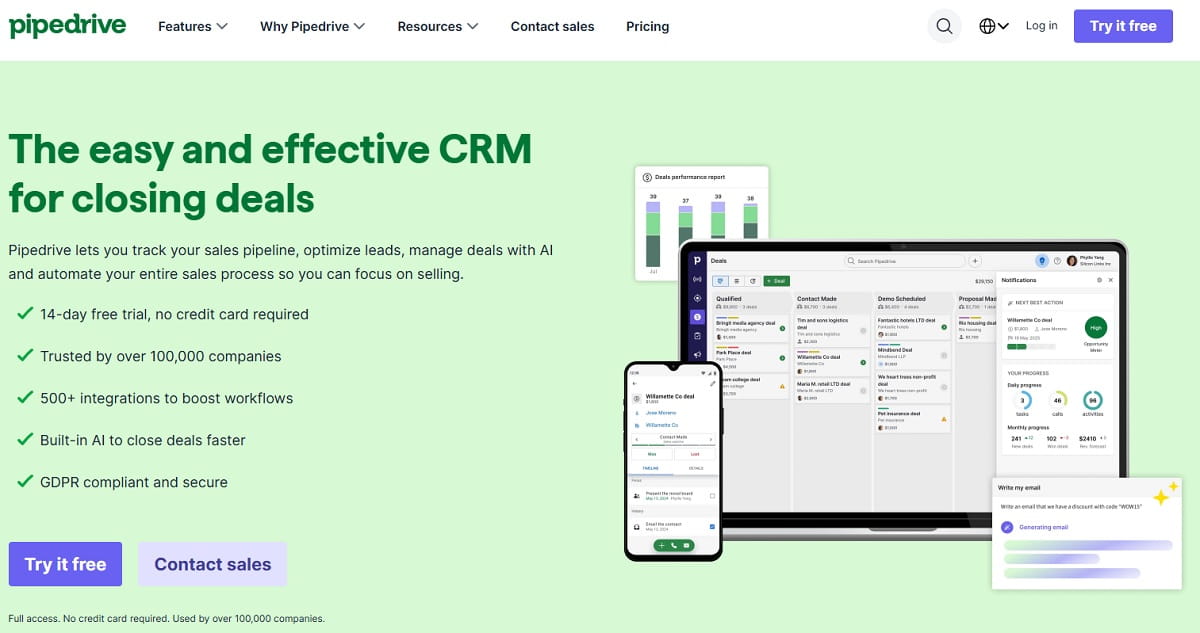
Pipedrive combines a visual sales pipeline with goals, performance dashboards, recurring revenue reporting, forecasts, and AI-assisted deal prioritization. Its official product page positions it as an accessible CRM for tracking leads, activities, and deals.
Best For: Small and mid-sized teams that want practical sales tracking without an enterprise CRM implementation.
Why It Stands Out: The pipeline is easy to understand, and reports stay close to daily selling activity. That supports adoption by reps who may resist a heavier system.
Limitations: Organizations requiring advanced multidimensional BI, complex territory models, or deeply governed enterprise forecasting may outgrow its native reporting.
7. Zoho Analytics — Best For Affordable Multi-Source Reporting
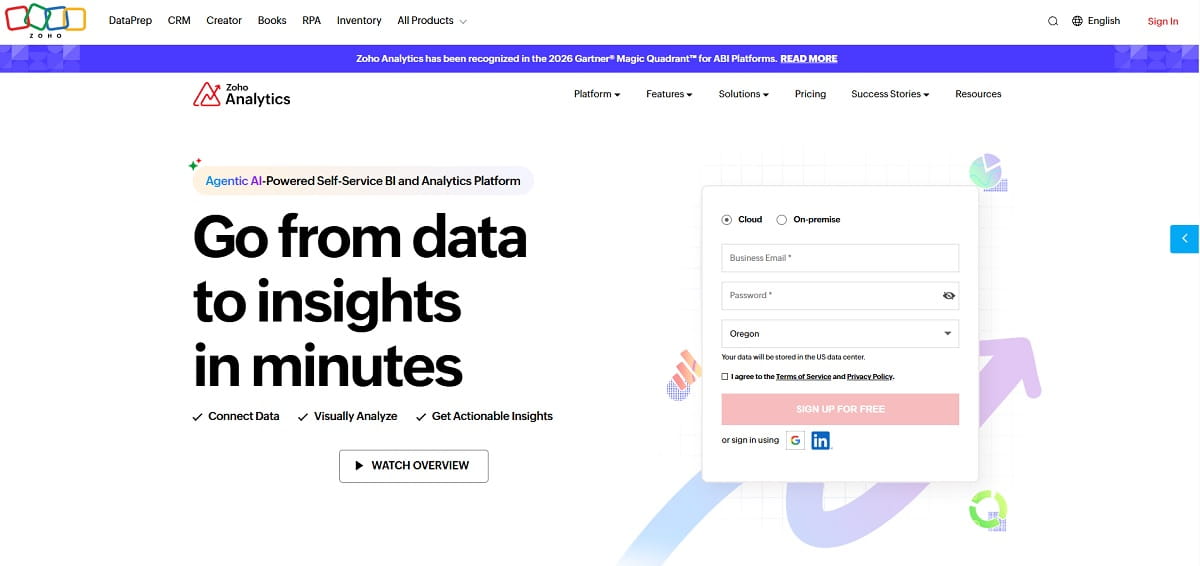
Zoho Analytics is a self-service BI platform that can connect and blend data from business applications, databases, files, warehouses, and other sources. It supports visual dashboards, data preparation, predictive analysis, anomaly detection, and natural-language questions through its AI assistant.
Best For: Teams that need more flexibility than native CRM reports but do not want the cost or complexity of a large enterprise BI deployment.
Why It Stands Out: It can combine sales, marketing, finance, and support information instead of limiting analysis to one CRM.
Limitations: A flexible BI tool does not automatically fix inconsistent source data. Someone must define joins, business rules, metric ownership, and refresh logic.
8. Microsoft Power BI — Best For Microsoft Ecosystems
Microsoft Power BI supports data modeling, visualization, sharing, and analysis across a wide range of sources. It is a natural option for organizations already using Excel, Microsoft Fabric, Azure, Dynamics 365, and Teams.
Best For: Companies that need custom sales dashboards and already have Microsoft data and analytics skills.
Why It Stands Out: Power BI can combine CRM opportunities, targets, product data, finance results, and marketing costs in a single governed model.
Limitations: Creating a dashboard is easier than creating a trustworthy model. Advanced DAX, data relationships, refresh architecture, workspace governance, and permissions require expertise.
9. Tableau — Best For Interactive Visual Exploration
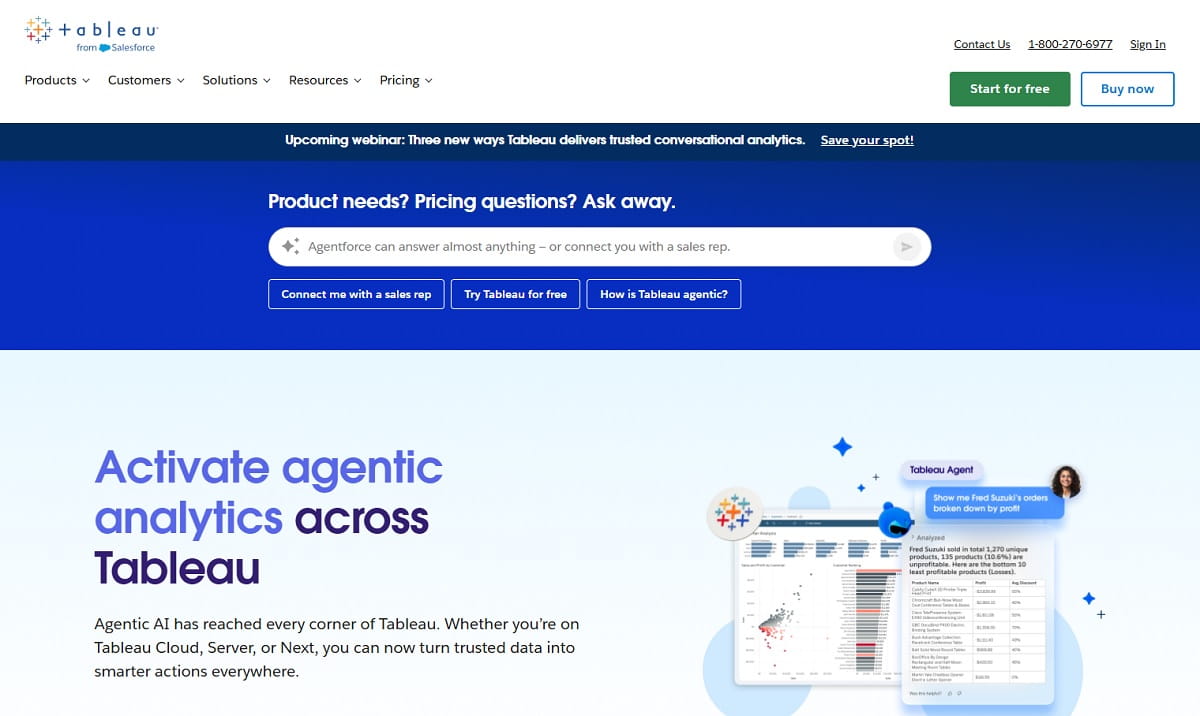
Tableau is known for interactive visualization and exploratory analysis. Sales analysts can use it to investigate performance by segment, territory, representative, product, cohort, and time period.
Best For: Analytics teams that value visual exploration and need to publish polished, interactive sales dashboards.
Why It Stands Out: Tableau is particularly effective when users need to move beyond static reports and explore relationships in complex datasets.
Limitations: Licensing, data preparation, governance, and dashboard maintenance require planning. Business users still need consistent metric definitions.
10. Looker — Best For Governed Warehouse Metrics
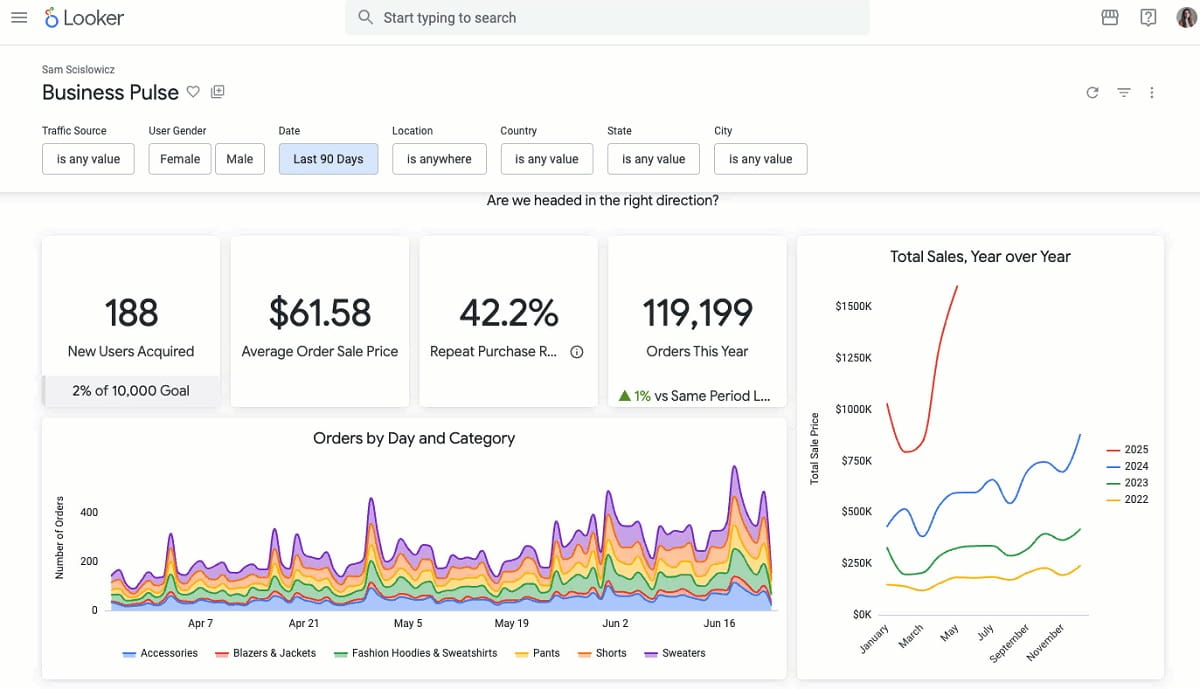
Google Cloud Looker is built around governed semantic modeling and data warehouse analysis. A company can define revenue, pipeline, conversion, and customer metrics once and reuse them across reports and embedded experiences.
Best For: Data-mature organizations with a cloud warehouse and engineering or analytics resources.
Why It Stands Out: A governed model reduces the risk that sales, finance, and marketing calculate the same KPI differently.
Limitations: Looker is not a plug-and-play sales dashboard for a small team. Modeling, warehouse architecture, and implementation skills are prerequisites.
11. Qlik Cloud Analytics — Best For Associative Data Discovery
Qlik Cloud Analytics lets users explore associations across data rather than following only a fixed drill-down path. That can help uncover relationships between sales performance, customer attributes, inventory, activity, and operations.
Best For: Organizations with complex datasets and analysts who need broad exploratory capabilities.
Why It Stands Out: Qlik can surface connected and excluded values during analysis, helping users examine why a segment performs differently.
Limitations: The platform can be more than a small sales team needs, and effective deployments require data and governance expertise.
12. Close — Best For High-Velocity SMB Sales
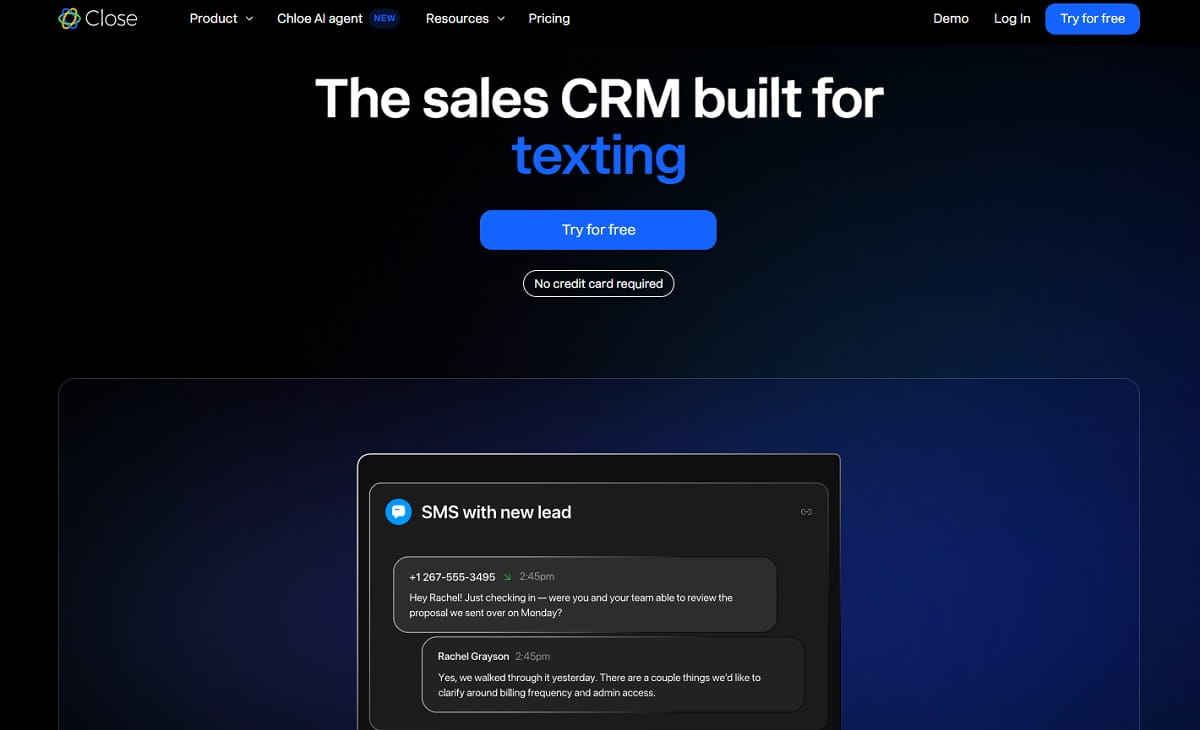
Close combines CRM, email, calling, SMS, automation, pipeline management, and reporting for sales teams that work through many leads quickly.
Best For: Startups and SMB sales teams that want communication and pipeline activity in one focused CRM.
Why It Stands Out: Reps can work from the same platform that records their communication activity, reducing gaps between execution and reporting.
Limitations: Large enterprises with complex forecasting, territory, governance, and BI requirements may need additional systems.
How To Choose Sales Analytics Software
Start With the Decision
Do not start a sales data analytics project with a feature list. Write down the decisions the platform must improve. Examples include reallocating website optimization effort, coaching representatives, inspecting pipeline risk, forecasting quarterly revenue, or comparing product profitability.
Match the Tool To the Data Source
- Choose Plerdy when the evidence lives in website behavior, ecommerce transactions, products, pages, and user interactions.
- Choose a CRM platform when the evidence lives in leads, accounts, opportunities, stages, and rep activities.
- Choose revenue intelligence when the evidence lives in calls, meetings, emails, deal movement, and forecasts.
- Choose BI when the decision requires data from CRM, finance, marketing, operations, and a warehouse.
Audit Data Quality Before Purchasing
Software cannot produce a credible win rate when stages are used inconsistently. It cannot forecast reliably when close dates are rarely updated. It cannot explain ecommerce revenue when transaction tracking is incomplete. Check required fields, duplicate records, event coverage, currency, time zones, refunds, permissions, and historical completeness before evaluating predictive features.
Calculate the Total Cost
Include licenses, premium connectors, data warehouse costs, implementation, migration, onboarding, administration, training, and dashboard maintenance. A lower subscription can become expensive if it requires extensive custom development. An enterprise platform can be wasteful if the team only needs five reliable reports.
Run a Realistic Pilot
Use one real team, one real pipeline or store, and one complete reporting period. A useful pilot should prove data accuracy, adoption, decision speed, and business value. Demo data proves only that the vendor can prepare a demo.
Sales Analytics Metrics To Track
| Metric | Formula Or Definition | Best Used For | Common Warning |
|---|---|---|---|
| Sales Conversion Rate | Won Sales ÷ Eligible Opportunities × 100 | Measuring Funnel Effectiveness | Define the Eligible Population Consistently |
| Win Rate | Won Opportunities ÷ Closed Opportunities × 100 | Comparing Segments And Teams | Do Not Exclude Closed-Lost Deals |
| Pipeline Velocity | Opportunities × Win Rate × Average Deal Value ÷ Sales Cycle | Estimating Revenue Movement | Small Input Errors Compound |
| Average Deal Size | Won Revenue ÷ Won Deals | Pricing And Segment Analysis | Compare Median When Outliers Are Large |
| Forecast Accuracy | Difference Between Forecast And Actual Revenue | Improving Planning Reliability | Keep Forecast Snapshots For Comparison |
| Quota Attainment | Actual Sales ÷ Sales Target × 100 | Team And Rep Performance | Targets Must Be Comparable |
| Purchase Conversion Rate | Orders ÷ Eligible Ecommerce Sessions × 100 | Online Store Performance | Separate Device And Traffic Segments |
| Average Order Value | Revenue ÷ Orders | Merchandising And Upselling | Check Discounts, Returns, And Margin |
| Revenue Per Visitor | Website Revenue ÷ Eligible Visitors | Connecting Traffic With Sales Quality | Do Not Treat All Traffic As Equal |
Sales Analytics Implementation Plan
Week One: Define
- Select three to five decisions the analytics system must improve.
- Define every KPI, population, currency, time window, and owner.
- Document source systems and known data-quality problems.
- Separate executive outcomes from diagnostic metrics.
Week Two: Connect
- Connect the minimum required data sources.
- Validate users, opportunities, transactions, revenue, refunds, and timestamps.
- Set roles and permissions before broad access.
- Create a data-quality report alongside the sales dashboard.
Week Three: Build
- Create one executive view and role-specific diagnostic views.
- Add segments for channel, product, device, region, rep, or customer type where relevant.
- Make every chart answer a decision question.
- Remove vanity metrics that do not change action.
Week Four: Operate
- Use the reports in a real sales, ecommerce, or revenue review.
- Record decisions and assign owners.
- Measure whether the tool reduced analysis time or improved an outcome.
- Fix unused reports instead of adding more dashboards.
Common Sales Analytics Mistakes
- Buying Before Defining: Teams purchase an enterprise platform without agreeing on the decisions or metrics it must support.
- Confusing Activity With Outcomes: More calls or clicks do not automatically mean more qualified pipeline or profitable orders.
- Ignoring Website Behavior: CRM data starts after a lead is captured and may miss the friction that prevented other visitors from converting.
- Ignoring CRM Discipline: Forecasting fails when stages, amounts, probabilities, and close dates are unreliable.
- Using One Dashboard For Everyone: Executives, managers, reps, ecommerce teams, and analysts require different levels of detail.
- Reporting Without Action: A metric has limited value when nobody owns the response to a negative change.
- Trusting AI Without Validation: Predictive outputs inherit the gaps and biases of source data.
Final Recommendation
The best sales analytics software depends on where your most important revenue evidence lives. Choose Plerdy when you need to connect website behavior, products, pages, traffic, and interactions with ecommerce sales. Choose Salesforce or HubSpot when CRM is the center of the sales process. Choose Gong for conversation intelligence, Clari for enterprise revenue forecasting, Pipedrive or Close for approachable pipeline management, and a BI platform when analysis must span several business systems.
Start with the decision, validate the data, and run a realistic pilot. The winning option among sales analytics tools is not the one with the most dashboards. It is the one that helps your team identify a revenue problem, choose an action, and verify the result with less uncertainty.
Frequently Asked Questions
What Is the Best Sales Analytics Software?
The best sales analytics software depends on the use case. Plerdy is best for website and ecommerce sales behavior, Salesforce for complex enterprise CRM analytics, HubSpot for growing revenue teams, Gong for conversation intelligence, Clari for forecasting, and Power BI for customizable cross-source reporting.
What Does Sales Analytics Software Do?
Sales analytics software collects and analyzes sales-related data to measure performance, inspect pipelines, understand customer behavior, forecast revenue, identify risks, and support better decisions. The exact capabilities depend on whether the platform is a CRM, revenue intelligence system, BI tool, or ecommerce analytics product.
How Is Sales Analytics Different From CRM?
A CRM stores and manages customer, lead, account, activity, and opportunity records. Sales analytics interprets those records to reveal performance, trends, risks, and forecasts. Many CRM platforms include analytics, while dedicated analytics tools can combine CRM information with finance, marketing, product, or website data.
Can Sales Analytics Software Improve Forecast Accuracy?
Yes, when opportunity stages, amounts, close dates, activity, and historical outcomes are recorded consistently. Forecasting software can detect risk and compare likely outcomes, but it cannot compensate fully for incomplete or unreliable CRM data.
Which Sales Analytics Tool Is Best For Ecommerce?
Plerdy is a strong choice for ecommerce teams that need to connect transactions with products, pages, traffic sources, navigation paths, and website interactions. It can be used alongside Shopify, WooCommerce, GA4, or a CRM to add behavioral context to sales results.
What Metrics Should Sales Analytics Software Track?
Common metrics include win rate, pipeline value, pipeline velocity, average deal size, sales cycle length, quota attainment, forecast accuracy, conversion rate, average order value, revenue per visitor, and customer acquisition cost. Track only metrics tied to a defined decision and owner.
Is Free Sales Analytics Software Enough For a Small Business?
A free plan can be enough when a small business needs basic pipeline, website, or ecommerce reporting. Upgrade when the team needs more history, users, integrations, automation, permissions, forecasting, or data volume. A smaller reliable reporting setup is better than an enterprise platform the team cannot maintain.
How Long Does Sales Analytics Implementation Take?
A focused implementation can produce an initial useful dashboard within two to four weeks. Enterprise deployments may take several months because they involve CRM cleanup, data models, integrations, permissions, historical migration, governance, training, and process changes.