
A/B testing compares randomly assigned versions of an experience to estimate whether a specific change causes a meaningful difference in user behavior. Reliable tests require more than a control, a variation, and a green “winner” badge. You need a testable hypothesis, a predefined primary metric, enough sample size, quality assurance, valid stopping rules, and an analysis plan written before the results are visible.
Key Takeaways
- Plan the decision before seeing the data. Define the hypothesis, eligible audience, primary metric, guardrails, MDE, sample size, and stopping rule in advance.
- Statistical significance is not business significance. A detectable lift may still be too small—or too expensive—to implement.
- Do not stop a fixed-horizon test when the graph looks favorable. Repeated peeking increases false-positive risk unless the method explicitly supports sequential monitoring.
- Check experiment health before interpreting outcomes. Broken tracking, unequal assignment, flicker, or different load speed can invalidate a result.
- “No significant difference” does not prove the versions are identical. The test may be underpowered or the true effect may be smaller than the chosen MDE.
What Is A/B Testing?
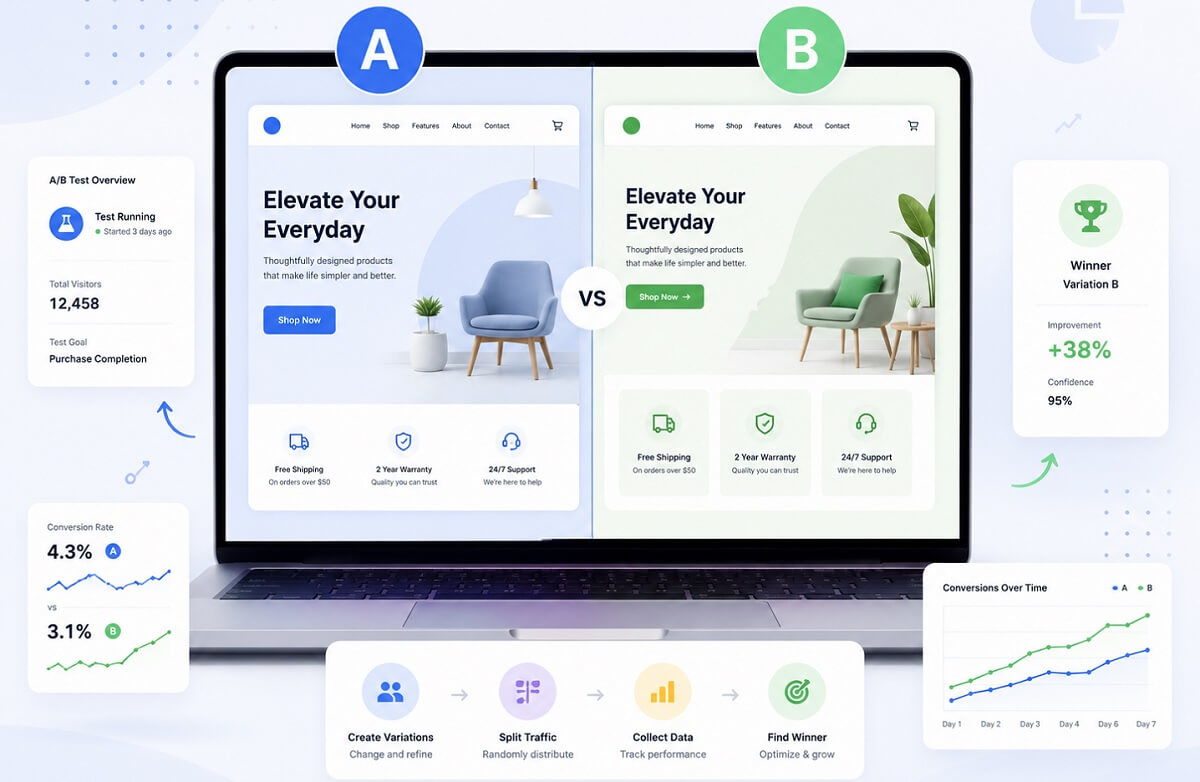
A/B testing—also called split testing—is a controlled experiment in which eligible users are randomly assigned to a control (A) or one or more variations (B, C, and so on). The groups run concurrently under comparable conditions. The difference in outcomes estimates the causal effect of the tested experience, subject to statistical uncertainty and correct implementation.
A website team might compare two signup forms, an ecommerce team might test delivery information near “Add to Cart,” and a SaaS team might test a new onboarding step. The purpose is not to discover which design people “like.” It is to make a defined product or marketing decision with measured risk.
A/B Test, Split-URL Test, or Multivariate Test?
| Method | What changes | Best use | Main tradeoff |
|---|---|---|---|
| A/B test | One focused experience or coherent treatment | Testing a clear hypothesis on the same URL | Cannot separate the contribution of many unrelated changes |
| Split-URL test | Users are temporarily sent to separate page URLs | Large template or flow changes | Requires careful redirect, canonical, analytics, and performance QA |
| Multivariate test | Multiple factors and combinations | Estimating individual and interaction effects | Needs much more traffic as combinations increase |
1. Confirm That A/B Testing Is the Right Method
An experiment is appropriate when two or more valid experiences are possible, the outcome is measurable, and enough eligible traffic can reach a decision in a useful timeframe. It is not a substitute for fixing defects or conducting exploratory research.
| Action | Use it when | Example |
|---|---|---|
| A/B test | The change has a plausible upside, but the business outcome is uncertain | Inline delivery estimate versus a shipping-policy link |
| Fix directly | The current experience is objectively broken, inaccessible, or noncompliant | The submit button fails in a supported mobile browser |
| Research first | You know a metric is weak but do not understand why | Checkout completion dropped after several simultaneous releases |
| Use another evaluation method | Traffic is too low or the decision cannot be randomized safely | Five enterprise deals per quarter or a critical security control |
Start with Evidence, Not a Backlog of Opinions
Use funnel analysis, heatmaps, session recordings, search data, customer feedback, usability testing, support tickets, and sales objections to find friction. Evidence should explain the problem; the experiment tests whether a proposed solution improves the defined outcome.
2. Write a Falsifiable A/B Testing Hypothesis
A useful hypothesis identifies the audience, evidence, proposed change, expected outcome, and mechanism:
Because mobile product-page visitors repeatedly open the shipping policy and then leave, we believe showing an estimated delivery date beside “Add to Cart” will increase mobile purchase conversion by reducing delivery uncertainty. We will monitor revenue per visitor and refund rate as guardrails.
A Reusable Hypothesis Template
Because [evidence], we believe [change] for [eligible audience] will improve [primary metric] by [mechanism]. We will consider it worthwhile if [MDE or decision threshold], while monitoring [guardrails].
Weak vs. Strong Hypotheses
| Weak | Why it fails | Stronger version |
|---|---|---|
| Make the CTA green | No evidence, mechanism, metric, or audience | Increase CTA contrast for mobile visitors who miss it, measured by qualified signup completion |
| Simplify checkout | “Simplify” is undefined | Remove three optional fields to reduce completion effort, measured by checkout completion |
| Try a new headline | No customer problem is identified | Replace feature-led copy with the top sales-call outcome, measured by demo requests from nonbrand traffic |
3. Choose One Primary Metric and Useful Guardrails
The primary metric determines the experiment decision. Choose it before launch and keep it stable. It should be sensitive enough to move, close enough to business value to matter, and attributable to the tested experience.
| Metric role | Purpose | Examples |
|---|---|---|
| Primary | Determines whether the treatment meets the experiment objective | Purchase rate, activated signup rate, qualified lead completion |
| Guardrail | Detects harmful side effects | Revenue per visitor, refunds, page speed, errors, unsubscribes |
| Diagnostic | Explains where and how behavior changed | CTA clicks, form starts, step completion, scroll depth |
| Long-term | Checks delayed value after rollout | Retention, repeat purchase, lifetime value, lead quality |
Do Not Let a Proxy Metric Become the Business Goal
A CTA treatment can increase clicks while lowering completed purchases. A shorter form can increase leads while reducing qualification. A discount can increase orders while reducing margin. Read the primary outcome together with guardrails and downstream quality.
Define the Metric Precisely
- Unit of analysis: user, session, account, store, or organization.
- Numerator and denominator.
- Eligibility and exclusion rules.
- Conversion window and attribution rule.
- Handling of repeat conversions, bots, refunds, and missing consent.
4. Calculate A/B Test Sample Size Before Launch
Sample size is driven by four inputs: baseline rate, minimum detectable effect (MDE), significance level, and statistical power. Underestimating it can leave a test unable to detect a worthwhile effect even when that effect exists. A practical research review on A/B testing sample-size calculations describes this as a source of misinformed and costly decisions. Read the sample-size research paper.
The Four Inputs
- Baseline conversion rate
- The current conversion probability for the eligible audience, ideally taken from a comparable stable period.
- Minimum detectable effect (MDE)
- The smallest change worth reliably detecting. Express clearly whether it is absolute or relative.
- Significance level (alpha)
- The planned false-positive risk under the null hypothesis. A two-sided 5% alpha is common, but it is not mandatory.
- Statistical power (1 − beta)
- The probability of detecting the specified effect when it is real. Eighty percent is a common planning value.
Relative Lift Is Not Percentage-Point Lift
Moving from 2.0% to 2.2% is a 0.2 percentage-point absolute increase and a 10% relative lift. Confusing these values can make a sample estimate wrong by orders of magnitude.
Approximate Formula for Two Conversion Rates
n per variant ≈ [z1−α/2√(2p̄(1−p̄)) + z1−β√(pA(1−pA) + pB(1−pB))]² ÷ (pB−pA)²
Here, pA is the baseline, pB is the baseline plus the MDE, and p̄ is their average. This normal approximation is educational. Use the method supported by your experimentation platform or a statistician for production decisions, especially with rare events, clustering, unequal allocation, multiple variants, or sequential designs.
Practical Sample-Size Planning Table
| Baseline rate | 10% relative MDE | 20% relative MDE | 30% relative MDE |
|---|---|---|---|
| 1% | 163,095 | 42,693 | 19,827 |
| 2% | 80,682 | 21,109 | 9,798 |
| 5% | 31,234 | 8,158 | 3,780 |
| 10% | 14,751 | 3,841 | 1,774 |
These rounded estimates illustrate the traffic cost of small effects. They are not universal platform requirements. Recalculate using your actual baseline and design.
Choose an MDE from Business Value
Do not enter an optimistic lift merely to make the test shorter. Estimate the smallest effect that would justify engineering effort, operational cost, design complexity, and potential risk. If only a 20% relative improvement would matter, power the experiment for 20%; if a 5% lift would create substantial value, accept that the required traffic will be much larger.
5. Plan Test Duration and Stopping Rules
Estimated days = total required sample ÷ eligible daily users
If a two-variant test needs 21,109 users per variant and receives 3,000 eligible users per day, the traffic-only estimate is about 15 days: 42,218 ÷ 3,000. Then account for weekday cycles, implementation ramp-up, conversion delay, exclusions, and traffic volatility.
“Run Every Test for Two Weeks” Is Not a Statistical Rule
Two weeks may cover weekday behavior, but it does not guarantee sufficient power. Conversely, a very high-traffic test can reach its planned sample sooner but may still need to cover operational cycles. Set both the sample requirement and time-related conditions before launch.
Avoid Unplanned Early Stopping
In a fixed-horizon test, repeatedly checking a conventional p-value and stopping when it crosses 0.05 inflates false-positive risk. Either wait for the prespecified sample and analysis point or use a valid sequential method configured for continuous monitoring. Research on always-valid inference describes approaches designed for decisions at arbitrary stopping times. Review the sequential-testing paper.
Stop Early for Safety, Not Convenience
Pause an experiment for severe technical defects, security or privacy problems, major revenue harm, or a violated guardrail according to a predefined rule. Document the reason. Do not silently discard the period and restart until a favorable result appears.
6. Randomize Correctly and Keep Assignment Stable

Eligible users should have a known probability of entering each variant, and each user should remain in the assigned experience. Switching the same shopper between control and treatment can contaminate behavior and weaken the comparison.
- Choose the correct randomization unit: user, account, household, store, or organization.
- Use concurrent groups; do not run A this month and B next month and call it an A/B test.
- Avoid cross-device contamination when account-level behavior matters.
- Prevent overlapping experiments from changing the same critical experience unless interactions are understood.
- Keep eligibility rules identical across variants.
7. Run an A/A Test When the Measurement System Is Unproven
An A/A test sends users to technically identical experiences. It can reveal assignment, logging, and analysis problems before a business treatment is introduced. Do not expect every metric to be numerically identical; random variation remains. Investigate systematic differences, sample-ratio mismatch, missing events, or device-specific discrepancies.
8. Complete Technical and Analytics QA
| Area | What to verify | Failure it prevents |
|---|---|---|
| Assignment | Users enter one variant and remain there | Cross-contamination |
| Eligibility | URL, audience, consent, and exclusion rules match the plan | Wrong population |
| Events | Primary and guardrail events fire once with correct values | False lift from duplicate or missing data |
| Design | Control and variation render correctly at key breakpoints | Layout and accessibility defects |
| Performance | Variants have comparable loading and interaction performance | Testing speed rather than the intended treatment |
| Flows | Forms, checkout, authentication, payments, and errors recover | Revenue or lead loss |
| Browsers | Supported browsers and devices pass | Segment-specific breakage |
| Reporting | Variant, exposure, conversion, and revenue data join correctly | Unusable analysis |
VWO’s implementation guidance likewise recommends previewing variations, avoiding changes to a live variation, and verifying goals across variants. See VWO’s test-creation QA guidance.
9. Monitor Experiment Health Without Chasing the Outcome
During the test, monitor assignment counts, sample-ratio mismatch (SRM), event volume, errors, performance, and severe guardrail harm. Do not use ordinary outcome fluctuations as a reason to stop early.
SRM occurs when observed assignment differs materially from the planned allocation—for example, a 50/50 test receives 55/45 traffic beyond what random variation plausibly explains. Possible causes include targeting differences, logging loss, bots, caching, redirects, or variant-specific errors. Resolve the cause before trusting the outcome.
10. Analyze the Primary Metric Before Exploring Everything Else
- Confirm experiment health and the planned sample.
- Analyze the prespecified primary metric with the chosen method.
- Report control and treatment rates, absolute difference, relative lift, uncertainty interval, and sample.
- Review guardrails and practical business value.
- Use diagnostic metrics to explain the result.
- Only then examine predefined segments and exploratory findings.
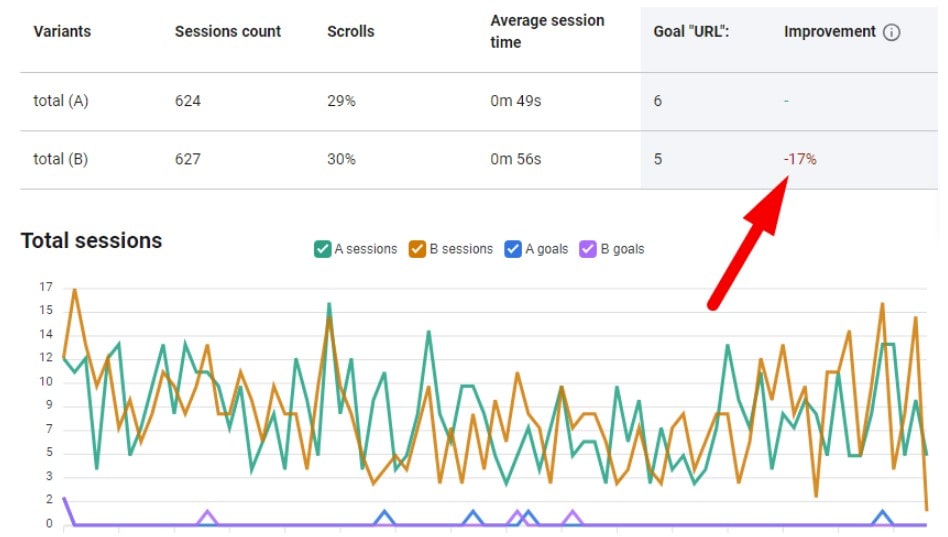
Report the Effect, Not Only “Significant” or “Not Significant”
Absolute lift = treatment rate − control rate
Relative lift = (treatment rate − control rate) ÷ control rate × 100
Suppose control converts at 4.0% and treatment at 4.4%. The absolute lift is 0.4 percentage points; the relative lift is 10%. Include a confidence or credible interval so readers can see the plausible range, not only the point estimate.
Statistical Significance Does Not Measure Importance
A tiny effect can be statistically significant with a large sample yet not justify implementation. A valuable effect can fail to reach significance in an underpowered test. Evaluate the interval against the MDE, expected revenue, costs, guardrails, and reversibility.
Control Multiple-Testing Risk
Every additional variant, metric, segment, and repeated analysis creates another chance to find a favorable result by luck. Predefine the primary decision, use appropriate multiplicity controls when making several confirmatory comparisons, and label post-hoc discoveries as exploratory hypotheses for later validation.
11. Analyze Segments Without Cherry-Picking
Mobile and desktop users can respond differently, but “significant on mobile and not significant on desktop” does not by itself prove that the treatment effect differs by device. That conclusion requires an interaction analysis or another valid comparison of effects.
Segment Safely
- Predefine business-critical segments such as device, new versus returning, plan, geography, or traffic source.
- Ensure each segment has enough observations and conversions.
- Compare effect sizes and uncertainty—not only separate p-values.
- Control for multiple comparisons when segment results drive decisions.
- Treat unexpected segment wins as exploratory until replicated.
12. Treat Inconclusive Tests as Information
An inconclusive test is not automatically a failure and should not be forced into a winner. It may show that the true effect is smaller than the test could detect, that the hypothesis was weak, or that the test lacked traffic.
| Finding | Interpretation | Reasonable next step |
|---|---|---|
| Interval excludes the worthwhile MDE | A business-relevant lift is unlikely under the assumptions | Keep control and move to a stronger idea |
| Interval is wide and includes harm and benefit | The experiment is under-informative | Improve measurement, increase sample if justified, or test a larger treatment |
| Primary metric is neutral but diagnostics move | Behavior changed without reaching the business outcome | Investigate the funnel mechanism and design the next hypothesis |
| Guardrail worsens | The treatment may trade short-term gain for harm | Do not ship without resolving the tradeoff |
| Implementation issue appears | The causal estimate may be invalid | Repair, document, and rerun only if the decision remains valuable |
13. Use A/B Test Ideas Tied to Real Business Problems
Ecommerce Example: Delivery Uncertainty
Evidence: Shoppers repeatedly open the shipping page from product pages and leave before adding to cart. Treatment: Show an estimated delivery range beside the purchase CTA. Primary metric: purchase conversion rate. Guardrails: revenue per visitor, cancellations, delivery-related contacts. Diagnostic: add-to-cart rate.
SaaS Example: Signup Activation
Evidence: Many signups complete registration but do not connect their first data source. Treatment: Replace the generic welcome screen with a three-step setup path based on the selected use case. Primary metric: activated accounts within seven days. Guardrails: support contacts, time to complete, and 30-day retention. Diagnostic: completion of each setup step.
Lead Generation Example: Form Friction
Evidence: Form recordings show exits at the budget field, while sales reports that budget is not needed before the first call. Treatment: Remove the field. Primary metric: qualified leads per eligible visitor. Guardrails: sales acceptance rate and booked meetings. Diagnostic: form completion.
Content Example: Trial CTA Context
Evidence: High-intent comparison-page readers reach the product section but rarely start a trial. Treatment: Replace a generic CTA with an outcome-specific CTA and concise implementation expectation. Primary metric: activated trials, not raw CTA clicks. Guardrails: signup abandonment and trial-to-paid rate.
14. Protect SEO During Website A/B Tests
Google Search Central states that website testing itself is not inherently a problem, but implementations should avoid cloaking and unnecessary long-running variations. For tests using separate URLs, Google recommends canonical links from alternate variants to the original URL and temporary 302 redirects rather than permanent 301 redirects while the experiment runs. Remove test URLs, scripts, and markup when the experiment ends. Read Google’s A/B testing guidance for Search.
- Do not show Googlebot a different treatment based on user-agent or IP.
- Keep the original URL canonical during split-URL testing.
- Use temporary redirects for temporary experiment routing.
- Do not leave an experiment running longer than needed.
- After the decision, implement the chosen experience on the canonical page and remove test infrastructure.
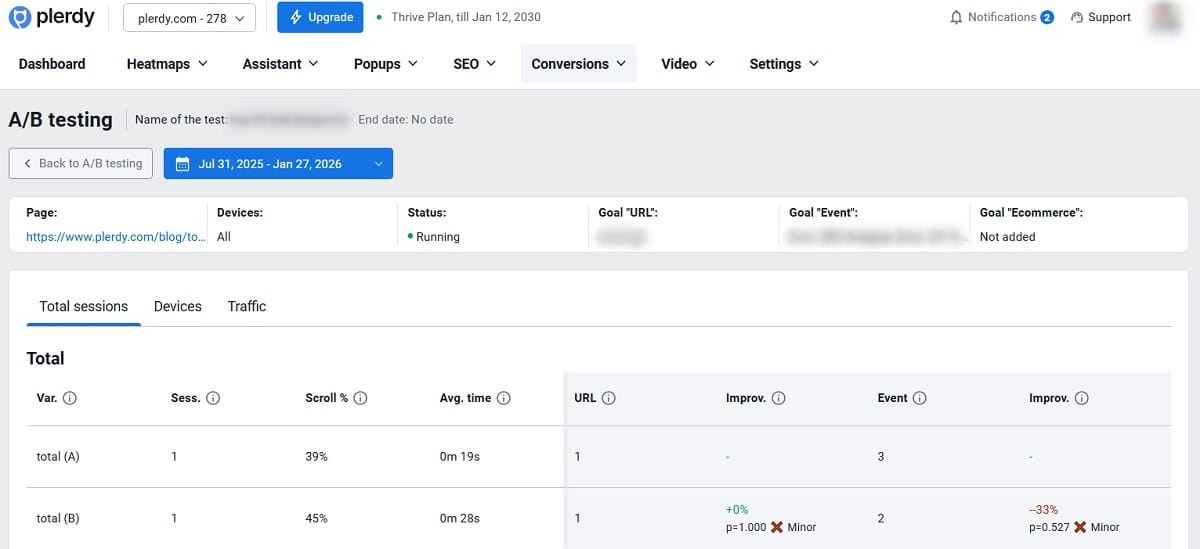
15. Build an Evidence-to-Experiment Workflow with Plerdy

Plerdy connects behavioral research with website experimentation. The useful workflow is not “test random buttons”; it is diagnose, prioritize, test, and verify.
- Find the leak. Use website funnel analysis to locate an important drop-off.
- Investigate behavior. Segment the website heatmap and session replays for the affected audience.
- Write the hypothesis. Connect the observed friction to a proposed treatment and business metric.
- Create and QA the variation. Configure the page, audience, goals, and variant in the Plerdy A/B Testing Tool.
- Run to the planned decision point. Monitor assignment, event quality, defects, and guardrails.
- Verify the result. Compare the primary outcome and use behavioral evidence to understand why the variant changed—or did not change—the funnel.
For the product-specific interface and setup steps, use the separate Plerdy website A/B testing tutorial.
A/B Testing Checklist
Before Launch
- The experiment answers one documented business decision.
- The hypothesis cites behavioral or customer evidence.
- Eligible audience, exclusions, and randomization unit are defined.
- One primary metric and relevant guardrails are locked.
- Baseline, MDE, alpha, power, sample size, and stopping rule are recorded.
- Overlap with other experiments is reviewed.
- Assignment, events, revenue values, consent states, and error flows pass QA.
- Control and treatment pass browser, device, accessibility, and performance checks.
While Running
- Monitor sample allocation and SRM.
- Monitor event volume, defects, performance, and guardrails.
- Do not edit variants mid-test.
- Do not stop a fixed-horizon test because the result looks favorable.
- Document campaigns, outages, and releases that may affect the test.
After the Test
- Validate experiment health before analyzing outcomes.
- Analyze the primary metric first.
- Report absolute effect, relative effect, interval, and sample.
- Review guardrails and practical business impact.
- Label post-hoc segment findings as exploratory.
- Document the decision, implementation, and follow-up measurement.
- Keep losing and inconclusive tests in the knowledge base.
A/B Testing Best Practices FAQ
How long should an A/B test run?
Run it until the prespecified sample requirement and relevant business-cycle conditions are met. Duration depends on baseline rate, MDE, power, eligible traffic, conversion delay, and the analysis method. “Two weeks” alone is not a sufficient stopping rule.
What statistical significance should an A/B test use?
A two-sided 5% significance level is common, but the appropriate threshold depends on the cost of false positives, false negatives, and the testing method. Choose it before launch and report effect uncertainty alongside significance.
What statistical power should an A/B test have?
Eighty percent is a common planning value, meaning an 80% chance of detecting the specified MDE when it is real under the model assumptions. Higher power requires more sample.
Can I stop an A/B test as soon as it reaches 95% significance?
Not in an ordinary fixed-horizon test. Repeatedly checking and stopping at a favorable moment increases false-positive risk. Use the planned sample and analysis point or a valid sequential method designed for continuous monitoring.
Can multiple A/B tests run at the same time?
Yes, when they target independent experiences or the platform and analysis account for interaction. Avoid uncontrolled overlap on the same page, funnel, audience, or metric because one treatment can change exposure or response to another.
Should mobile and desktop users be analyzed separately?
Predefine device segments when the experience or business decision differs. Ensure adequate sample and compare treatment effects directly. A significant result on one device and a nonsignificant result on another does not alone prove a device interaction.
What should I do with an inconclusive A/B test?
Review the effect interval, experiment health, MDE, and sample. If a worthwhile lift is unlikely, keep control and test a stronger idea. If uncertainty remains wide, improve measurement or collect more data only when the decision justifies it.
Can low-traffic websites run A/B tests?
Only for sufficiently large effects or higher-frequency metrics. Otherwise use customer interviews, usability testing, session recordings, funnel analysis, and carefully monitored larger changes. An underpowered A/B test does not become reliable by running indefinitely.
Should an A/B test change only one element?
Test one coherent hypothesis, which may require several coordinated changes. If you change unrelated elements together, you can estimate the bundle’s effect but cannot attribute the result to one component.
Does A/B testing hurt SEO?
Not when implemented responsibly. Avoid cloaking, canonicalize temporary variant URLs to the original, use 302 redirects for temporary split tests, and remove experiment infrastructure when the test ends, following Google Search Central guidance.
Reliable A/B Testing Is a Decision Process
The strongest A/B testing programs do not celebrate the largest number of winners. They make better decisions with known uncertainty. Start with evidence, define what would be worth changing, calculate the traffic required, protect the experiment with QA and guardrails, and analyze the decision you planned before exploring the rest.
A losing or inconclusive result can still improve the next hypothesis. What matters is that the experiment remains trustworthy enough for the team to act, or confidently decide not to act.
Try Plerdy
Track, analyze, and turn visitors into buyers with AI-powered insights.