

Ecommerce conversion rate optimization (CRO) is the systematic process of finding and removing the friction that prevents store visitors from buying. It combines quantitative analytics, user-behavior evidence, customer feedback, UX improvements, and controlled experiments. The goal is not to chase an arbitrary conversion benchmark. It is to help more qualified shoppers complete a purchase while protecting revenue, margin, average order value, and customer trust.
Key Takeaways
- Diagnose before redesigning. A low storewide conversion rate does not identify the page, audience, or interaction causing the loss.
- Measure money, not clicks alone. A test that increases add-to-cart clicks but reduces revenue per visitor is not a win.
- Separate defects from hypotheses. Broken buttons and unreadable forms should be fixed; uncertain changes should be tested.
- Reduce uncertainty as well as effort. Shoppers need clear product, delivery, return, total-cost, and payment information.
- Segment every important result. Device, source, new versus returning visitors, category, geography, and discount status can reveal opposite behaviors hidden by an average.
What Is Ecommerce Conversion Rate Optimization?

Ecommerce conversion rate optimization is a repeatable program for increasing the percentage of qualified store visitors who complete a valuable action. The primary macro conversion is usually a purchase. Micro-conversions—using search, viewing a product, selecting a variant, adding to cart, or starting checkout—help teams locate friction, but they are not substitutes for revenue.
Good ecommerce CRO is broader than changing a button color. It answers four questions:
- Where is value being lost? Identify the page, funnel step, segment, or interaction with abnormal drop-off.
- Why are shoppers hesitating or failing? Combine behavior data with direct customer evidence.
- What is the smallest credible improvement? Create a solution tied to the observed cause.
- Did the change improve the business? Validate purchases and revenue without damaging margin, returns, or customer experience.
CRO Is Not the Same as Traffic Acquisition
SEO, paid media, affiliates, and social campaigns bring people to a store. Conversion optimization improves what happens after they arrive. The disciplines are connected: better acquisition improves traffic quality, while better CRO increases the value of qualified traffic. Sending more visitors into a leaking funnel merely makes the leak more expensive.
Why Ecommerce CRO Matters
Conversion gains compound across existing traffic. If a store receives 100,000 sessions per month, converts 2% of sessions, and has a $75 average order value, it produces 2,000 orders and $150,000 in revenue. At a 2.4% conversion rate, the same traffic and order value produce 2,400 orders and $180,000 in revenue—a $30,000 difference before acquisition spend changes.
This is an illustration, not a promised uplift. Real outcomes depend on traffic quality, product demand, price, inventory, seasonality, and implementation.
How to Calculate Ecommerce Conversion Rate
Ecommerce conversion rate = purchases ÷ eligible sessions × 100
For example, 320 purchases from 16,000 eligible sessions produce a 2% session conversion rate.
You can also calculate a user-based rate:
User conversion rate = purchasers ÷ eligible users × 100
Session-based and user-based rates answer different questions, so document the denominator and use it consistently. Also define how the reporting system handles consent, bots, cross-device journeys, canceled orders, subscriptions, and duplicate purchase events.
Build a Funnel, Not Just One Rate
| Metric | Formula | What it helps reveal |
|---|---|---|
| Product-view rate | Product viewers ÷ sessions | Navigation, merchandising, search, and landing-page relevance |
| Add-to-cart rate | Sessions with add to cart ÷ product-view sessions | Offer clarity, product information, variants, trust, and CTA usability |
| Cart-to-checkout rate | Checkout starts ÷ carts | Unexpected costs, coupon distraction, cart errors, and purchase readiness |
| Checkout completion rate | Purchases ÷ checkout starts | Form, payment, delivery, account, error, and trust friction |
| Revenue per visitor | Revenue ÷ visitors | Combined impact of conversion rate and order value |
What Is a Good Ecommerce Conversion Rate?
A good ecommerce conversion rate is one that improves profitably against a comparable baseline. A universal percentage can mislead because conversion rate changes with industry, price, device, country, traffic source, brand familiarity, stock availability, and how analytics defines a session or purchase.
Use external benchmarks for context, not as a target detached from your business. Your most useful comparison is usually the same store and segment during a comparable period.
| Control | Compare like with like | Avoid |
|---|---|---|
| Device | Mobile with mobile; desktop with desktop | Blended rates that hide a weak mobile experience |
| Traffic | Brand search, nonbrand search, paid social, email, and direct separately | Judging low-intent prospecting traffic against returning email users |
| Customer | New and returning shoppers separately | Assuming the same trust and purchase history |
| Product economics | Similar categories, prices, and purchase cycles | Comparing low-cost replenishment items with luxury products |
| Time | Comparable weekdays, promotions, and seasonal periods | Comparing Black Friday with an ordinary week |
| Measurement | The same event definitions and attribution rules | Mixing platform dashboards with different denominators |
The 8-Step Ecommerce CRO Process
The best ecommerce CRO strategy is a loop, not a one-time redesign. Use the following process to move from evidence to action.
1. Define the Business Objective and Guardrails
Start with a business outcome such as increasing new-customer revenue per visitor or reducing mobile checkout abandonment. Choose one primary metric and several guardrails. If a discount raises purchase rate but destroys contribution margin, the test has optimized the wrong outcome.
- Primary metric: purchase conversion rate or revenue per visitor.
- Diagnostic metrics: product views, add to cart, checkout starts, payment errors.
- Guardrails: average order value, gross margin, refund rate, cancellation rate, page performance, and support contacts.
2. Audit Analytics Before Trusting the Dashboard
Confirm that product views, add-to-cart actions, checkout starts, purchases, revenue, currency, coupons, and refunds are captured correctly. Place a test order on desktop and mobile. Check for duplicate purchase events and compare analytics orders with backend orders. An inaccurate baseline can make a losing test appear successful.
Recheck tracking after every checkout, theme, consent-banner, or URL change. For stores using Google tags, Consent Mode can change how tags behave when a visitor grants or denies consent. Keep the consent implementation legally reviewed for the markets you serve, and verify that the expected ecommerce events still fire under each supported consent state. Google documents the available consent types and implementation behavior in its Consent Mode guidance.
3. Find the Largest Funnel Leaks
Segment the funnel by device, browser, traffic source, landing page, category, new or returning customer, and geography. Look for meaningful differences, not merely the page with the highest exit count. A high-volume page will naturally generate more exits; the opportunity is an abnormal rate multiplied by business impact.
4. Collect Behavioral Evidence
Use click heatmaps, scroll maps, and session replay software to investigate what aggregate analytics cannot explain. Look for repeated clicks on unresponsive elements, missed CTAs, abandoned variant selectors, search loops, form errors, and mobile overlays blocking content.
In Plerdy, create segments for the page and audience implicated by the funnel data. For example, review mobile paid-social sessions that reached a product page but did not add to cart. A narrow segment provides more useful evidence than watching random recordings.
5. Listen to Customer Language
Analyze onsite feedback, search terms, zero-result searches, support tickets, live-chat transcripts, reviews, return reasons, and short exit surveys. Ask questions that reveal the barrier: “What stopped you from completing your purchase today?” is more actionable than “Do you like our website?”
6. Write an Evidence-Based Hypothesis
A useful hypothesis connects evidence, change, audience, and outcome:
Because mobile shoppers repeatedly open the size guide and leave without selecting a variant, we believe replacing the image-based guide with a readable inline chart and fit guidance will increase mobile add-to-cart rate by reducing sizing uncertainty. We will monitor purchases and size-related returns as guardrails.
This is stronger than “Make the size guide better” because the team can test and falsify it.
7. Fix, Test, or Research
| Action | Use it when | Example |
|---|---|---|
| Fix | The experience is objectively broken or inaccessible | Add-to-cart does nothing in a supported mobile browser |
| A/B test | Two valid experiences may produce different business outcomes | Inline delivery date versus a shipping-information link |
| Research further | Evidence identifies a symptom but not a credible cause | Category exit rate rose after several simultaneous changes |
8. Learn and Repeat
Record the hypothesis, screenshots, audience, dates, metric definitions, quality-assurance checks, result, and decision. Keep inconclusive and losing tests in the repository; they prevent repeated mistakes and improve future hypotheses. CRO maturity is the ability to learn reliably, not the percentage of tests declared winners.
Ecommerce Conversion Optimization, Page by Page

Homepage and Landing Pages: Make the Next Step Obvious
- Match the promise and product category to the ad, email, or search query that brought the visitor.
- Use a clear value proposition instead of an unsupported superlative.
- Prioritize the primary shopping path over sliders and competing promotions.
- Expose shipping region, key policies, and meaningful trust evidence early.
- Send campaign traffic to the most relevant collection or product rather than automatically using the homepage.
Navigation, Category Pages, and Search: Help Shoppers Find the Right Product
- Use category labels customers understand, not internal merchandising terminology.
- Provide useful filters for price, size, color, availability, compatibility, rating, or other category-specific attributes.
- Preserve filter state when a shopper returns from a product page.
- Show price, variants, review summary, and stock information needed to compare items.
- Support common synonyms and misspellings in site search.
- Turn zero-result searches into recommendations and a source of merchandising insight.
Product Pages: Answer the Questions Blocking “Add to Cart”
Product page optimization should reduce uncertainty about fit, quality, compatibility, delivery, returns, total cost, and what happens after the click.
| Observed behavior | Possible cause | Evidence to collect | Potential response |
|---|---|---|---|
| High views, low add to cart | Weak offer or unanswered questions | Feedback, recordings, review themes, competitor offer audit | Clarify benefits, proof, delivery, returns, or product details |
| Repeated clicks near images | Users expect zoom or another view | Click maps and recordings | Add clear zoom, video, scale, or detail photography |
| Variant errors | Selection is unclear or unavailable | Event data and recordings by device | Improve labels, stock states, size guidance, and error messages |
| Reviews rarely reached | Proof is too low on the page | Scroll depth and anchor clicks | Surface a review summary and link near the purchase area |
| Mobile CTA is missed | Poor hierarchy or obstructive UI | Mobile heatmaps and viewport review | Simplify the first screen; test a non-obstructive sticky CTA |
Cart: Make Cost and Commitment Predictable
- Show item, variant, quantity, price, discounts, estimated shipping, and order total clearly.
- Let shoppers edit or remove an item without losing the cart.
- Explain the free-shipping threshold without manipulating shoppers.
- Do not let the coupon field visually overpower the checkout CTA or encourage shoppers to leave in search of a code.
- Keep cross-sells relevant and secondary to checkout.
Baymard reports an average cart-abandonment rate of 70.19%. Its US survey also identifies late extra costs as the leading reported reason for abandonment, while forced account creation remains a major barrier. These findings support showing total costs early and keeping guest checkout visible; they do not mean every abandoned cart is recoverable. Review Baymard’s cart-abandonment research.
Checkout: Remove Preventable Failure
- Offer guest checkout prominently; invite account creation after purchase.
- Request only information needed to complete and fulfill the order.
- Use persistent, visible labels—not placeholders as the only labels.
- Support autofill and appropriate input types.
- Explain delivery dates, shipping methods, taxes, and fees before payment.
- Preserve entered data after an error.
- Identify the exact field and explain the correction in text.
- Offer payment methods appropriate to the audience without cluttering the page.
- Provide clear recovery when a card is declined or a payment session expires.
The W3C recommends explicit labels, keyboard access, clear instructions, and descriptive error handling for forms. These practices improve access and also reduce avoidable confusion during checkout. See the W3C accessible forms tutorial.
Post-Purchase CRO: Protect Retention and Reduce Refunds
The conversion journey does not end when the purchase event fires. A confusing confirmation page, missing delivery expectations, or poor onboarding can create support contacts, cancellations, refunds, and negative reviews. Those outcomes reduce the value of the original conversion and weaken future purchase confidence.
Optimize the First Minutes After Purchase
- Confirm the order, payment status, items, delivery address, and estimated delivery clearly.
- Explain what happens next and where customers can track or change the order.
- Make support, returns, and exchanges reachable without forcing customers to search the site.
- For products that require setup, provide concise instructions before confusion becomes a return.
- Offer only relevant cross-sells that complement the order; do not turn confirmation into another obstacle course.
Turn Post-Purchase Questions into CRO Research
Group support tickets, return reasons, exchanges, and review complaints by theme. If customers repeatedly ask where to find tracking, how sizing works, or whether an accessory is compatible, the pre-purchase experience probably failed to answer the same question. Feed those themes back into product-page, cart, and checkout hypotheses.
A practical monthly exercise is to label the latest 50 support conversations, rank the five most frequent preventable questions, and assign each one to the page where the answer should have appeared.
Mobile CRO, Site Speed, and Accessibility
Optimize Mobile as Its Own Shopping Context
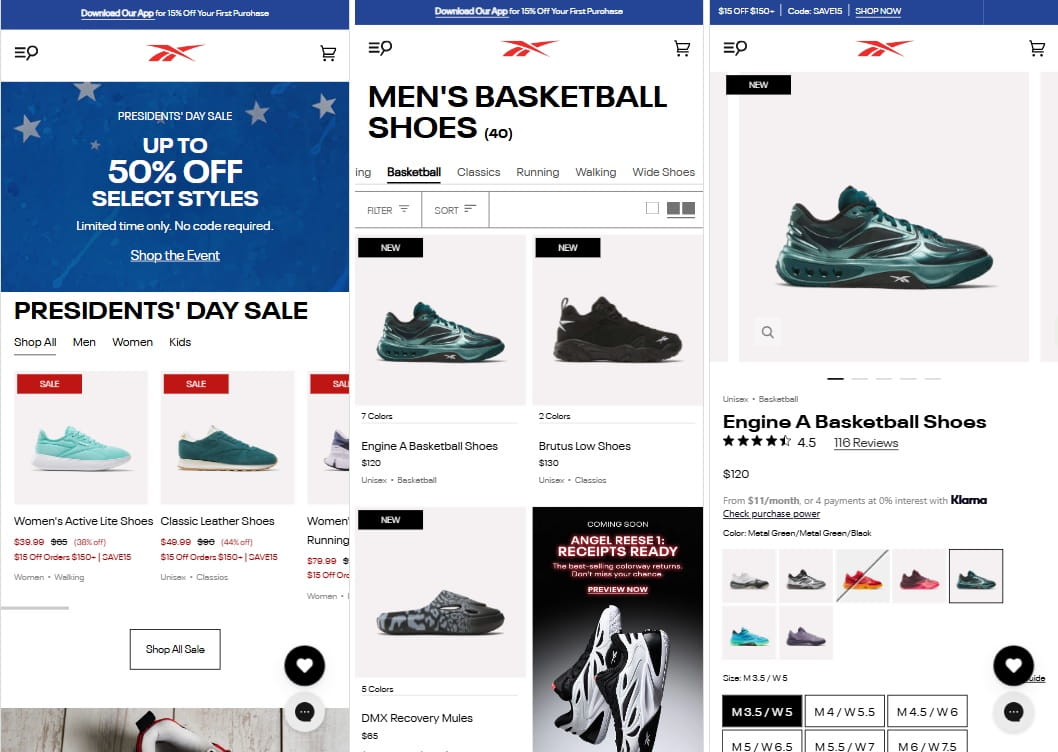
Do not treat mobile as a compressed desktop layout. Test product galleries, filters, menus, variant selectors, sticky elements, cart drawers, address entry, payment, and error recovery with one hand and real device keyboards. Segment recordings by viewport and browser because a problem affecting only one mobile environment can disappear inside a storewide average.
Use Core Web Vitals as Diagnostics, Not a CRO Guarantee
Performance affects whether shoppers can interact smoothly, but a faster confusing offer remains confusing. Monitor real-user Largest Contentful Paint, Interaction to Next Paint, and Cumulative Layout Shift on high-value templates. Optimize hero images, third-party scripts, fonts, app code, and layout stability, then verify the result in field data.
- LCP: 2.5 seconds or less at the 75th percentile is classified as “good.”
- INP: 200 milliseconds or less at the 75th percentile is classified as “good.”
- CLS: 0.1 or less at the 75th percentile is classified as “good.”
These are Google’s user-experience thresholds, not promises of a particular conversion lift. Review the definitions and measurement guidance in web.dev’s Core Web Vitals documentation.
A 2026 web.dev case study reports that Nuvemshop improved LCP health across its ecommerce platform and observed an 8.9% increase in mobile conversion rate for the analyzed cohort. This is a useful real-world example, not a universal prediction for every store. Read the Nuvemshop case study on web.dev.
Accessibility Is Part of Conversion Quality
Keyboard access, visible focus, sufficient contrast, meaningful alternative text, labeled inputs, and understandable errors enable more people to shop successfully. Accessibility review should accompany usability testing and cannot be replaced by an automated score alone.
How to Prioritize Ecommerce CRO Ideas
Use a simple evidence-and-impact model instead of choosing the loudest stakeholder request.
Priority score = (Reach × Impact × Evidence × Confidence) ÷ Effort
Use a consistent 1–5 scale. The number is not scientific truth; it makes assumptions visible and comparable.
| Hypothesis | Reach | Impact | Evidence | Confidence | Effort | Decision |
|---|---|---|---|---|---|---|
| Repair broken mobile variant selector | 5 | 5 | 5 | 5 | 1 | Fix immediately |
| Show delivery estimate near CTA | 5 | 4 | 4 | 4 | 2 | High-priority test |
| Replace hero image | 5 | 2 | 1 | 2 | 2 | Research first |
| Add complex personalization engine | 3 | 3 | 2 | 2 | 5 | Defer |
Do Not A/B Test Everything
Fix clear defects, compliance problems, and severe accessibility failures. Test changes when reasonable alternatives exist and the outcome is uncertain. Low-traffic stores can combine usability tests, customer interviews, before-and-after monitoring, and larger changes rather than running underpowered button-level experiments.
Ecommerce CRO Metrics That Protect Revenue Quality
| Metric type | Examples | How to use it |
|---|---|---|
| Business outcome | Revenue per visitor, contribution margin per visitor, purchase conversion rate | Determine whether the change created business value |
| Funnel diagnostic | Product-view, add-to-cart, checkout-start, and checkout-completion rates | Locate the stage affected by a change |
| Order quality | Average order value, units per order, discount rate | Ensure more orders are not merely smaller or unprofitable |
| Post-purchase | Refunds, returns, cancellations, support contacts | Detect misleading promises or poor-fit purchases |
| Experience | Errors, rage clicks, dead clicks, search exits, Core Web Vitals | Explain why performance changed and find new issues |
Calculate Revenue Impact Carefully
Estimated incremental revenue = eligible visitors × absolute conversion-rate change × average order value
If 50,000 eligible visitors move from 2.0% to 2.2%, the absolute change is 0.2 percentage points, or 0.002 as a decimal. At a $90 average order value, the estimated incremental revenue is $9,000 for that traffic volume. Apply margin, refund, and implementation costs before presenting the result as profit.
Troubleshooting: What to Check When Conversions Drop
A conversion decline after a release does not automatically prove that the design idea was wrong. Check measurement and implementation before drawing a behavioral conclusion.
| What changed | Check first | Then investigate |
|---|---|---|
| Checkout was simplified, but purchases fell | Purchase and checkout events, payment methods, validation, address logic, and preserved input | Recordings for retries, silent errors, missing delivery details, or trust loss |
| Product-page layout changed, but add to cart fell | CTA visibility, variant functionality, stock state, price, and device-specific rendering | Heatmaps and scroll depth for missed information or new distractions |
| Speed score improved, but conversion did not | Whether real-user field metrics improved on money pages—not only a lab score | Offer relevance, product uncertainty, navigation, and checkout friction |
| Conversion rate rose, but revenue fell | Average order value, discounts, product mix, margin, and attribution | Whether the experience favors low-value orders or suppresses useful upsells |
| Overall conversion is stable, but mobile revenue fell | Device mix, browser errors, sticky UI, payment options, and mobile page performance | Segmented funnels and recordings for the affected devices and traffic sources |
If a critical defect is confirmed, roll it back or repair it promptly. If tracking is sound and no defect appears, analyze the predefined test metrics and evidence instead of selecting a convenient explanation after the result.
A 90-Day Ecommerce CRO Plan
| Period | Work | Deliverable |
|---|---|---|
| Days 1–15 | Validate analytics, define metrics, map the funnel, segment performance, and repair critical defects | Trusted baseline and issue log |
| Days 16–30 | Review heatmaps and recordings, analyze search and feedback, conduct usability sessions | Evidence library and top friction themes |
| Days 31–45 | Write hypotheses, estimate reach and impact, score effort and evidence | Prioritized experiment backlog |
| Days 46–75 | Design, QA, launch, and monitor the highest-value experiments | Completed tests with documented results |
| Days 76–90 | Roll out validated changes, review guardrails, document learnings, plan the next cycle | Decision log and next-quarter roadmap |
How to Run Ecommerce CRO with Plerdy
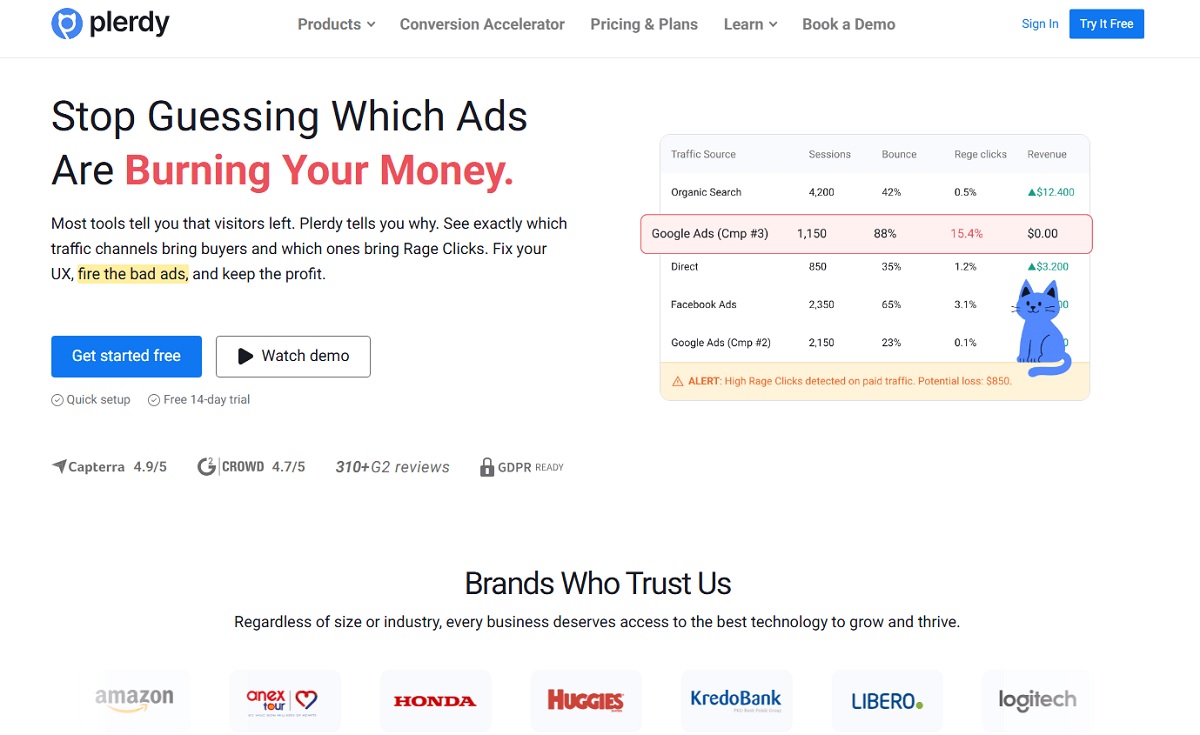
- Map the purchase funnel. Track entry, product view, add to cart, checkout, and thank-you steps with website funnel analysis.
- Locate interaction friction. Use the website heatmap tool to compare clicks and scroll depth across devices and traffic segments.
- Watch the failure sequence. Open relevant session recordings instead of sampling sessions at random.
- Connect behavior to revenue. Use ecommerce analytics to prioritize interactions and products with financial impact.
- Validate the solution. Run a controlled experiment with the Plerdy A/B testing tool when the outcome is uncertain and traffic is sufficient.
Ecommerce CRO Checklist
Measurement
- Purchase, revenue, currency, coupon, and refund events are validated.
- Analytics orders are reconciled with backend orders.
- The funnel is segmented by device, source, customer type, and category.
- Primary, diagnostic, and guardrail metrics are documented.
Research
- Heatmaps and recordings are reviewed for the affected segment.
- Site-search terms and zero-result searches are analyzed.
- Support, reviews, feedback, returns, and exit-survey themes are grouped.
- Each hypothesis cites evidence rather than preference.
Product Discovery and Product Pages
- Navigation, search, filters, and sorting match customer language.
- Images answer questions about detail, scale, use, and fit.
- Price, variants, stock, delivery, returns, and guarantees are clear.
- Add to cart works across supported devices and browsers.
- Reviews and proof are visible without overwhelming the purchase path.
Cart and Checkout
- Costs and delivery expectations appear before payment.
- Guest checkout is visible.
- Forms use labels, autofill, correct input types, and descriptive errors.
- Entered data survives validation errors.
- Payment failures provide a clear recovery path.
Experimentation
- Audience, hypothesis, primary metric, and stopping rules are set before launch.
- Variants pass analytics, browser, device, performance, and accessibility QA.
- Results include revenue and guardrail metrics.
- Winning, losing, and inconclusive tests are documented.
Ecommerce CRO FAQ
What is ecommerce conversion rate optimization?
Ecommerce conversion rate optimization is the evidence-led process of improving a store so more qualified visitors complete purchases or other valuable actions. It uses analytics, user research, UX improvements, and experimentation.
How do you calculate an ecommerce conversion rate?
Divide purchases by eligible sessions and multiply by 100. For example, 200 purchases from 10,000 sessions equal a 2% session conversion rate. Document whether your organization uses sessions or users as the denominator.
What is a good ecommerce conversion rate?
There is no reliable universal target. Compare your rate with the same store, device, channel, customer type, category, and season. Use external industry benchmarks only as context.
What should an ecommerce business optimize first?
Start with tracking defects and broken purchase-path interactions. Next, investigate the highest-value funnel leak. For many stores, that means high-traffic product pages, cart, or mobile checkout, but the data should determine the priority.
Does a higher add-to-cart rate mean CRO is working?
Not necessarily. Add to cart is a diagnostic metric. Confirm that the change also improves purchases or revenue per visitor without harming average order value, margin, refunds, or cancellations.
How long should an ecommerce A/B test run?
Run the test until it reaches the preplanned sample requirement and covers relevant business cycles. Do not stop solely because a dashboard briefly shows a winner. Account for weekly patterns, promotions, and delayed conversions.
Can a low-traffic ecommerce store use CRO?
Yes. Validate tracking, fix defects, interview customers, run usability tests, analyze recordings and feedback, and make larger evidence-based improvements. Avoid small underpowered A/B tests that cannot produce a dependable decision.
Which tools are useful for ecommerce CRO?
A practical stack includes transaction analytics, funnel analysis, heatmaps, session recordings, customer feedback, performance monitoring, and an experimentation platform. The right stack should connect behavior to business outcomes without duplicating tools your team will not use.
Turn Ecommerce CRO into a Learning System
Ecommerce conversion optimization works when a team can repeatedly connect a business loss to observed customer friction, implement a credible solution, and measure the result. Begin with trustworthy data. Study one important segment at a time. Fix what is broken, test what is uncertain, and judge success by sustainable revenue, not by a prettier page or a temporary click increase.
The strongest first step is simple: identify the highest-value funnel leak and review the relevant sessions. That gives the next CRO decision a foundation in real behavior rather than opinion.