
Hi there!
My name is Marta, I am a Marketing Manager, and in this video, we will learn how to analyze data if there is A/B testing.
Before we start – make sure you subscribe to our channel and don’t miss new videos.
Put, A/B testing allows us to see which variation (version) works better for your audience based on statistical analysis. This is a good practice for bigger online stores with enough traffic.
So how Can we Use Plerdy for A/B Testing?
(Open a heatmap) Let’s imagine we want to test this filter button, and for 50% of users, we show it. For the other 50 – no.
First, we need to create the desired user group. We go to Settings – user groups and create two groups (we already explained how to create groups in one of the previous videos)
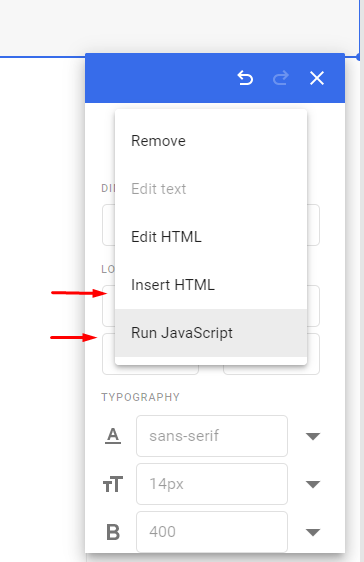
Then you need to add these groups to each required test as a custom JS in the Google Optimize
When you set that up, in the heatmap, you will be able to choose a specific user group on the right and see the performance of two groups of users.
Everything is on the one URL, in the one heatmap.
For smaller websites Also, there are some other opportunities to compare the data without AB testing and what you should know is:
- If the item was on the site and replaced or removed, Plerdy does not show clicks.
- Another thing, you can compare clicks by events in Plerdy or visually on the page by selecting the desired period in the calendar.
- Have many identical elements on the site’s pages. Plerdy can show all clicks from all pages on one page.
- You can segment all clicks by traffic channels.
- Plerdy saves and shows all clicks in dynamics without screenshots. This allows you to see much more data.
- To see all the clicks for different versions of A/B testing, add the items during this period. All clicks will be displayed automatically.
Hope this information will help you successfully set up A/B testing!
For more information – watch other videos and subscribe to our channel.
How to Analyze A/B Test Results with Plerdy

A/B testing offers a systematic approach to understanding user behavior. Dive deep into data-driven decision-making with Plerdy, a powerful platform dedicated to refining and optimizing user experience.
Consider a niche example: online shoe retailers. They might tweak the color and placement of the ‘Add to Cart’ button. With Plerdy, these variations are not just set up effortlessly but also analyzed with precision.
Key steps for analyzing A/B test results in Plerdy:
- Initiate Test Analysis: Open up the Plerdy dashboard, zoom into the specific test you’ve conducted, and access the comprehensive report.
- Quantitative Breakdown: Drill into metrics like ‘Targets count’ and ‘Sessions count’ for a snapshot of user interactions.
- Visual Comparisons: Use interactive graphs to weigh variant performances side-by-side, making decision-making more intuitive.
- Deep Dive Data Tables: Dig deeper to understand which variant outperforms the other, guiding you on actionable next steps.
- Snapshot Review: Use test snapshots to quickly review each variation’s performance without diving too deep.
For online businesses, say a digital e-magazine, tweaking the subscription button’s placement can make all the difference in conversion rates. Plerdy ensures that such changes aren’t based on hunches, but on hard data. So, whether you’re revamping a product page or refining ad copy, Plerdy equips you with insights to make informed decisions. Dive into Plerdy and turn your A/B testing efforts into measurable results.
Have a great one!
Bye!