

Let’s see what makes Plerdy clickmap a useful tool to perform independent usability audits and increase conversion rate on a website. To clarify that, we will take a closer look at the purpose, functionality and advanced settings of the click heatmap.
So, what practical tasks does Plerdy solve?
- Records visitors’ clicks on objects on the pages of a website. This allows you to see which elements have the right location and perform their functions and which remain unnoticed.
- Collects statistics on scrolling of pages, giving a chance to assess the readability of content and see whether it is interesting to users.
- Records traffic sources and number of clicks on each page by channel. Thanks to this you can evaluate the activity of different user segments.
- Shows a live click heatmap. In other words, it demonstrates all objects clicked during a certain period of time, on a certain device or by users from one of the traffic channels.
The work of Plerdy is mainly based on the collection of data on users’ clicks on different groups of elements of a site (titles, buttons, images etc).
You can individually set up customized tags allowing to see clickability statistics of separate (customized) elements of a site.
Overview of tools in Plerdy website heatmap
Plerdy consists of two complementary parts:
- A navigation panel where you can directly view a heatmap.
- A dashboard, which is used to set a website heatmap and collect all statistics.
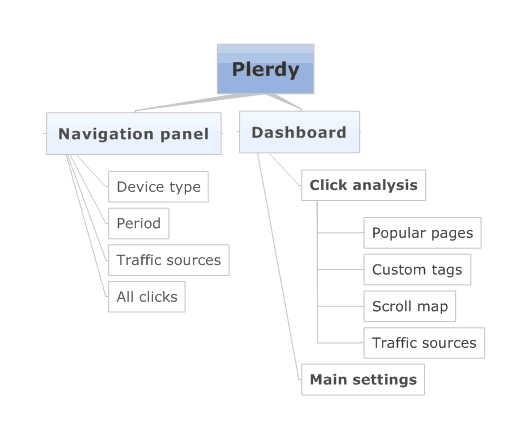
1. Navigation panel
The navigation panel is a separate part of Plerdy. You can launch it on your website pressing Ctrl+Alt+H (or cmd+Alt+H for iOS). The navigation panel can be opened only if you have already placed the script of a website heatmap.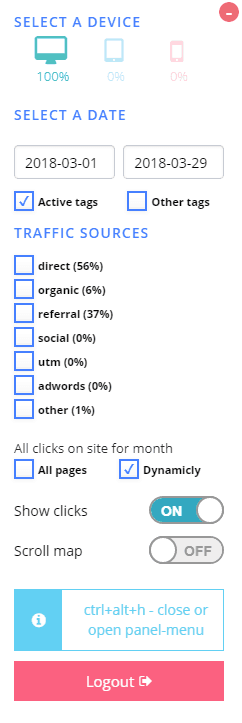
The navigation panel is used to view heatmap data directly on a website. You only need to switch between pages to see the main statistics on clicks.
In addition, with the navigation panel, you can segment users by 3 types of devices, choose the period to view, and sort clicks by different traffic channels.
It also allows choosing the type of tags to view (the default setting is all main elements of the site layout). In case there are other custom tags set in the dashboard, here you can enable viewing them (“Other tags”).
One of the benefits of Plerdy website heatmap is the opportunity to view clicks on dynamic objects (drop downs, menus, banners etc.). To enable this option, choose the dynamic mode of view. If you check “All pages”, you will be able to view online all clicks on pages made during the last month. “Show clicks” and “Hide clicks” buttons enable and disable the display of data.
If you need, you can leave the navigation panel. It can also be collapsed for more convenient switching between the pages of a site. To collapse the navigation panel, click the corresponding icon in the top left corner.
2. Dashboard
All functionality of the dashboard is divided into 2 blocks:
- Click analysis. The block of tools to work with the statistics of heatmaps.
- Main settings. The block with settings of the service.
The Click analysis block has the following sections:
- Popular pages.
- Custom tags.
- Scroll map.
- Traffic sources.
1. POPULAR PAGES
The section where you can view all statistics on clicks on the pages of a web resource. It has a few options typical for all other tools of the site:
Filters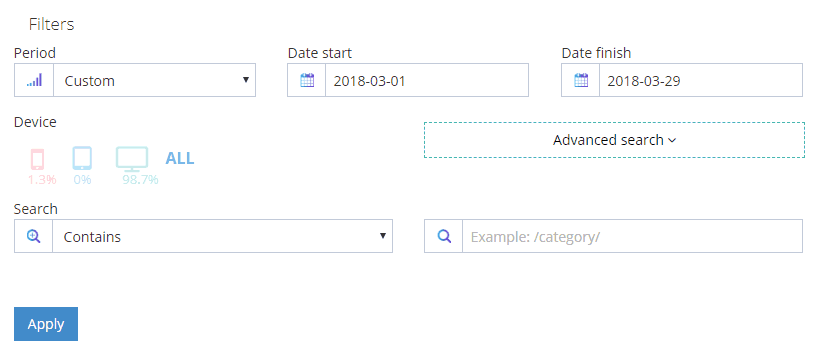
Filters help to segment results by:
- period (today, yesterday, or the selected period);
- device (smartphone, tablet or desktop);
- characteristics of a page (URL or Title) with a segment or exact match search.
Clicks by days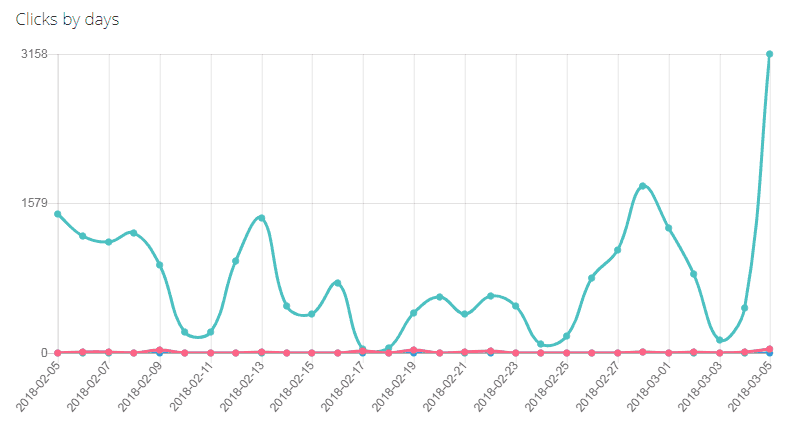
Clicks by days is a graph of clicks for the last month segmented by device type.
Statistics of clicks on pages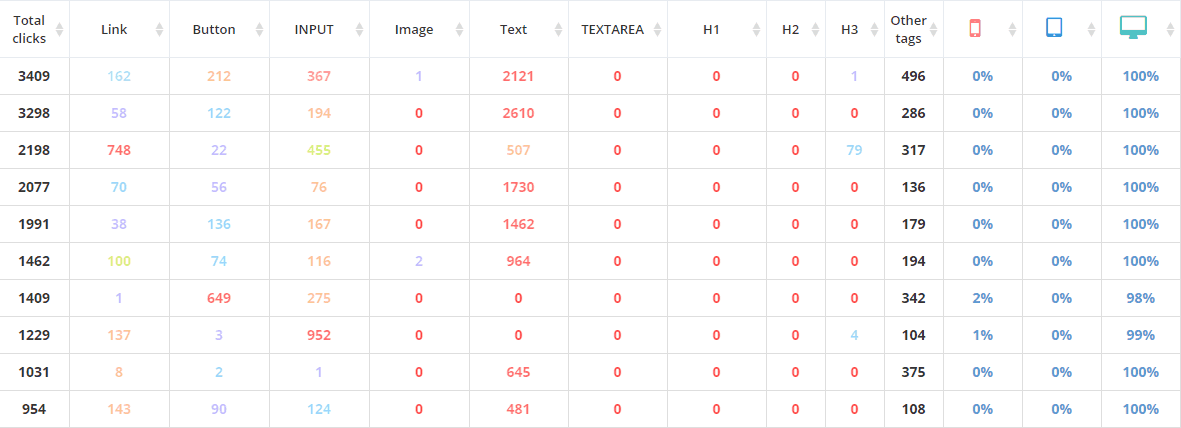
Detailed information about clicks on the elements of each page of the site. Also, you can view a percentage ratio of clicks based on device type.
Popular pages section contains aggregated information of a heatmap which is used to view user activity and the most clickable elements of a web resource.
2. CUSTOM TAGS
A section that shows click statistics on manually customized labels. With the help of custom tags, you can separately choose on which elements of a site clicks will be collected. This solution allows you to collect statistics on clickability of different unusual elements or individually set a website heatmap based on your goals.
3. SCROLL MAP
This is a section with scroll statistics of a site presented as a table. You can use time filters to choose the necessary time period. The graph visualizes the overall statistics of the scroll of website pages: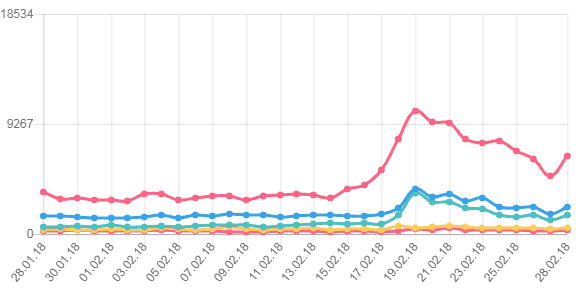
This tool helps to view the scroll depth of each page.
In particular, such approach has practical benefits when it is necessary to determine the level of users’ interest in the offered content.
4. TRAFFIC SOURCES
A section to view data on user behavior segmented by traffic channels, countries, and devices. As in the previously mentioned sections, here you also can filter all information
by time period or display the statistics of a separate page based on a Title or an URL: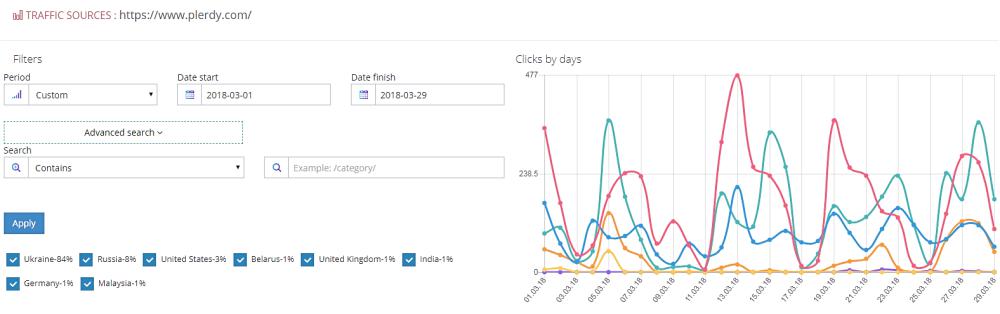
You can also combine different data, for example, view click activity of a chosen page by channel adding the country filter. It’s very convenient if you promote your web resource in a certain country and run special offers or promotional campaigns.
The Main settings block consists of the following sections:
- Tracking code
- Price
- Payment history
- User profile
- Referral program
- Custom tags
- IP blocking
1. TRACKING CODE
A section with the script that collects the click heatmap on a website. If the code hasn’t been implemented yet, here you can complete all steps for its generation and further implementation on the site.
2. PRICE
If necessary, in this section of the tool you can change an access package. All rates can be paid on a monthly or annual basis (in case of an annual subscription 20% discount is offered).
3. PAYMENT HISTORY
Here all statistics on payments for Plerdy website heatmap usage is stored.
4. USER PROFILE
In this section, you can set your personal user data: name, profile photo, and linkage to social media. Here you can also change your password.
5. REFERRAL PROGRAM
The referral program is one of the ways to benefit from the registration of your acquaintances and partners in Plerdy. You just have to provide them with a link indicated in this section and wait until the person completes the first payment for the service.
6. CUSTOM TAGS
This is a section for setting custom tags of the website click heatmap.
7. IP BLOCKING
IP blocking is a tool to form the list of IP addresses, clicks from which shouldn’t be included in the map and general statistics. These may be the IPs of developers’ computers, administrators, or owners of the web resource.
Advanced settings of Plerdy website heatmap
HOW TO VIEW WEBSITE HEATMAPS IN MOBILE DEVICE MODE
With Plerdy you can view wtbsite heatmaps of pages that were opened on smartphones. To see the activity of mobile version visitors, follow these steps:
- Open mobile view mode in the Developer console:
- Chrome: Ctrl+Shift+I or F12;
- Opera: Ctrl+Shift+С;
- Mozilla Firefox: Ctrl+Shift+C or F12.
- Choose the screen resolution of a mobile device.
- Launch the navigation panel of Plerdy website heatmap pressing Ctrl+Alt+H (or cmd+Alt+H for iOS). If necessary, fill in credentials to sign into the panel.
- Select view for mobile option (red smartphone icon).
This way you will be able to learn how users see your site on smartphones. Such analysis of clicks will show to what extent the current layout is convenient for mobile users.
HOW TO VIEW WEBSITE HEATMAPS OF A CART AND DYNAMIC OBJECTS
Modern web resources have a lot of interactive elements. By viewing website heatmaps in the cart of an online store you get a chance to see the data that remains unavailable in the majority of other website heatmaps.
To do this, open the website of your online store, add an item to the cart, and launch Plerdy navigation panel. The data on the cart and other dynamic elements of the site will immediately become available. The listed functions of Plerdy website heatmap are the basic ones.
Developers keep working to improve the tool and create new solutions. If you come up with any questions or suggestions related to the functionality of website heatmap, do not hesitate to email us at [email protected].