
Our team has visited numerous exhibitions and conferences dedicated to website analysis using the best click heatmap software. On some of them, we were guests, on other – participants. We always summarize the results and assess the findings of every event. Among other things, we also create a rating of the most popular questions. Usually, it includes 10-12 options related to modern software alternatives.
Plerdy has more products and features compared to other software heatmaps.
The most common questions were:
- Why are your tools better than the software of your competitors?
- Why do I need a heatmap at all?
- Can a heatmap substitute Google Analytics?
- Can I record user screens with the help of a heatmap?
- Is it difficult to read the results of a heatmap?
We reviewed the collected ratings at the end of the year to see which questions we’re most frequently asked. Surprisingly, it was “Why are your tools better than the software of your competitors?”
By the way, not everyone who asked this question could name our competitors or software alternatives. Some of them mentioned the software with similar features at first sight but complete different tasks. They even named the software that is no longer active.
Also, some online marketers have asked a more precise question like “Well, for example, how Plerdy is better than Hotjar or Yandex.Metrica alternatives?”. In such cases, it was clear that they already knew the pros and cons of heatmaps and expected some practical cases.
We have prepared a separate article on these alternatives since conferences and exhibitions don’t give enough time to explain the differences between Plerdy, Hotjar, and Yandex, metrics website heat mapping software in detail. However, it includes examples of how each of the heatmap software works in the same situation. All tests were conducted on a separate resource – demo.plerdy.com.
This article will be interesting to anyone who understands usability and why it’s necessary to run website analysis with the best heatmap software. It will be even more useful for those who already run website usability audits and monitor what alternatives appear on the market.
CONTENTS
- How does heatmap software work?
- What is Hotjar heatmap software? Hotjar vs. Plerdy vs. Yandex.Metrica as the main three heatmap software alternatives
- Comparison of heatmap software alternatives: heatmaps advantages and disadvantages
How Does Heatmap Software Work?

Heatmap software records user behavior on a website by collecting different kinds of interactions, such as clicks, scrolls, and hovers. Such tools process data in real-time to instantly display any significant events on heatmaps in the color-coded form. For example, the more visitors interact with a specific element, the hotter it becomes on the heatmap. Cold colors like blue or green mean that visitors are inactive in this area and don’t pay attention to its content.
The best heatmapping software is multifunctional and consists of many software with rich functionality. The most common elements of the best website analysis software are:
- Heatmap software. This software displays all website elements and areas clicked by visitors with the number of interactions.
- Scroll map software. This software shows how deep visitors scroll the page helping marketers to see whether the published content is relevant.
- Sequences of clicks software. This software shows how to order visitors to interact with the elements on a page to reflect their navigation path.
- Mouse hover map. This software displays how often visitors hover over a specific element or place on a page.
- Session recording software. This software records all critical interactions completed by visitors in a video-like format.
By combining the data from these heatmaps, web marketers and website owners can get a bird’ eye view of user behavior. The software shows what people do on pages, when, and how.
What is Hotjar Heatmap Software

This heatmap software is a kit of tools for user behavior analysis. It comprises click, move, and scroll heatmaps, visitor recording software with session replays, and several additional surveys and feedback collection tools. Some of these tools are free in the basic subscription plan with limited features.
Website owners and marketers usually leverage the software to track visitors’ behavior on web resources. The heatmap information helps them improve website design, enhance customer experience, and tailor marketing efforts to every visitor.
The Hotjar software is probably the most renowned website analytics software because of its simple interface and convenient features. It displays user behavior data on easy-to-read heatmaps, so there is practically no learning curve. To use this heatmap software, you need to sign up for the tool, add its tracking code to your website, and create a heatmap for the page you want to target.
Hotjar Pricing
This heatmapping software offers three paid pricing plans and a free subscription. The free subscription lets you collect around 2,000 page views/day and benefit from 365-day data storage. The cheapest pricing, called Personal Plus plan, costs €39 / month. The pricing of Business and Agency accounts varies depending on the number of page views and other extras.
Hotjar Alternatives
The variety of web analytics software is striking. Some of them provide effective alternatives to Hotjar and offer advanced capabilities that it doesn’t have. On the list of the best alternatives, Plerdy and Yandex.Metrica tools particularly stand out. Read more about these best competitors below.
Heatmap Software: Plerdy vs. Hotjar
At first sight, both competitors have similar features. The Plerdy software also includes click, scroll, and hover heatmaps, offers session recording, and helps to collect customer feedback through smart forms. Besides, both tools provide free subscriptions to let customers test the available features before investing in paid pricing plans.
So what are the differences between these heatmap software competitors? First, the Plerdy tool enables website owners to record data on dynamic objects with 99% accuracy, which Hotjar software cannot do. It also sends SEO alerts to keep you updated on the important changes on your website. Secondly, the standard Plerdy plan is cheaper than the equivalent subscription plan of Hotjar.
On the flip side, Hotjar has a richer functionality than Plerdy and stronger community support. Moreover, this tool boasts a long history and has already released many tutorials and documents available on the web. Yet, since the Plerdy team continuously perfects its software, the chances are that they will fill this gap very soon.
Plerdy Pricing
This heatmap software is available in 6 pricing plans, ranging from a free version to enterprise pricing. You will be asked to pay $14/month for the most affordable subscription. Growth, Business, and Premium plans cost $29, $59, and $99, respectively. If you need heatmapping software for enterprise use, you can contact the Plerdy team to discuss your needs.
Heatmap Software: Yandex.Metrica vs Hotjar
Whereas the Hotjar tool is mainly heat mapping software, Yandex.Metrica is designed for general website analytics. It provides description reports and tracks the actions of specific visitors with Yandex.Metrica can also determine where the traffic is coming from and segment the recorded information by different attributes. Even though, similarly to Hotjar, it includes several heatmap alternatives, they aren’t the software’s core features.
Hence, if you want to focus on customer behavior analysis or collect customer feedback, one of the Hotjar software plans is the best choice. This software can provide detailed insight into every important action completed on your web resource.
If you need reporting features, segmented statistics, and more general data on your website performance, consider using Yandex.Metrica. This 100% free tool can help you understand what’s going on with your online resource.
Yandex.Metrica Pricing
Yandex.Metrica is a free analytics software with unlimited traffic, number of sites per account, and access to support. Such pricing makes it best for companies without a digital marketing budget.
Comparison of Heatmap Software Alternatives: Heatmaps Advantages And Disadvantages
In this overview, we are going to compare the best heatmapping software competitors based on the following characteristics and features:
- The speed of data updates
- Recording clicks on dynamic elements feature
- Data on empty clicks
- Recording clicks from smartphones
- Scroll heatmap feature
- How user behavior data is displayed after design changes
- Screen recording of user behavior
- How are heatmaps displayed
1. The Speed of Data Updates
Let’s start with comparing the speed of data updates in the analyzed alternatives.
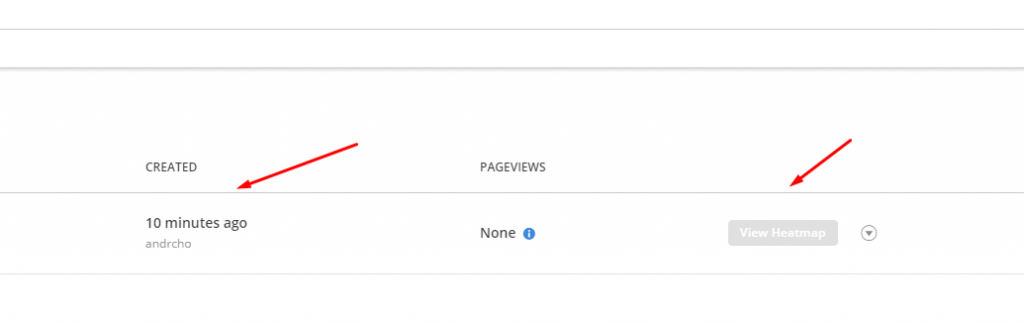
To see a heatmap report in the Yandex.Metrica dashboard, you will have to wait from 3 to 10 minutes. During this time, the tools records and processes data to display the following result:

The screenshot shows the coordinates of clicks and the relative temperature corresponding to the frequency of clicks on the element compared to other interactions on the page.
Displaying data in the Hotjar dashboard takes approximately as much time:
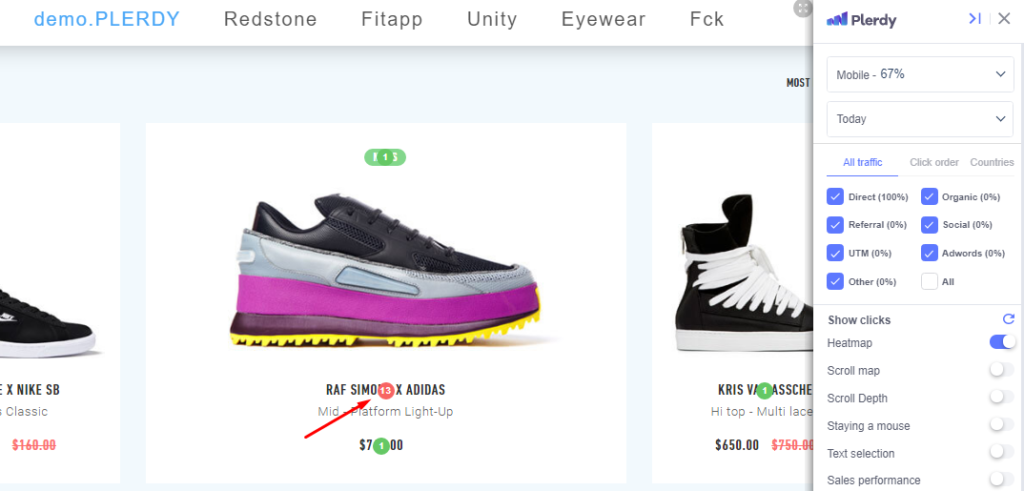
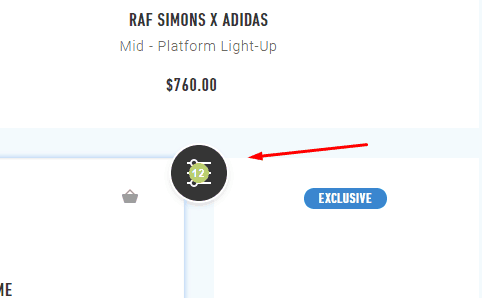
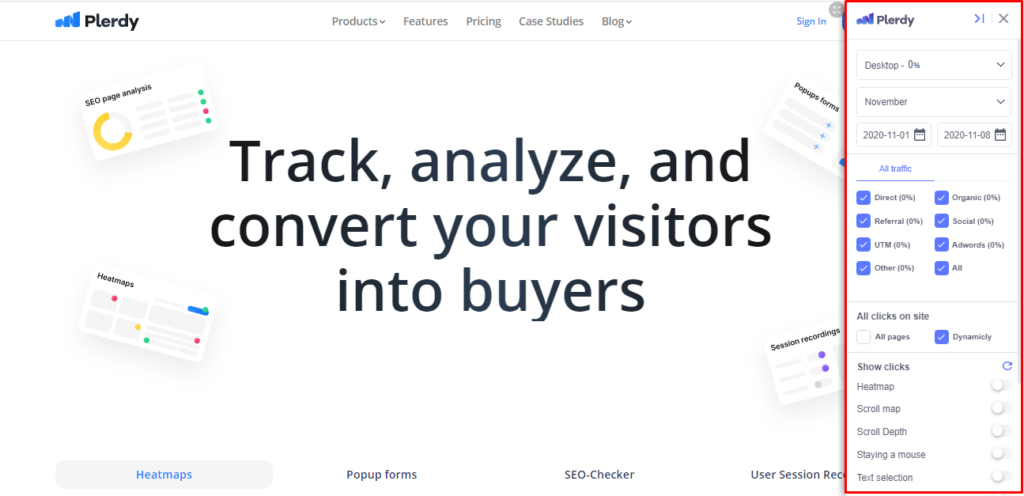
The Plerdy tool displays the data on each page in real time regardless of its volume. So you can see clicks right after they are made:
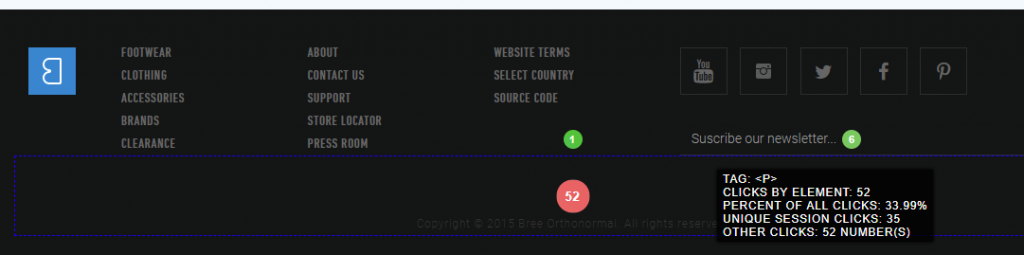
The result is associated with an element (in this case, the tag). When you hover it, additional statistics opens the number of clicks compared to other elements on the page and the number of unique session clicks.
2. Recording clicks on dynamic elements feature
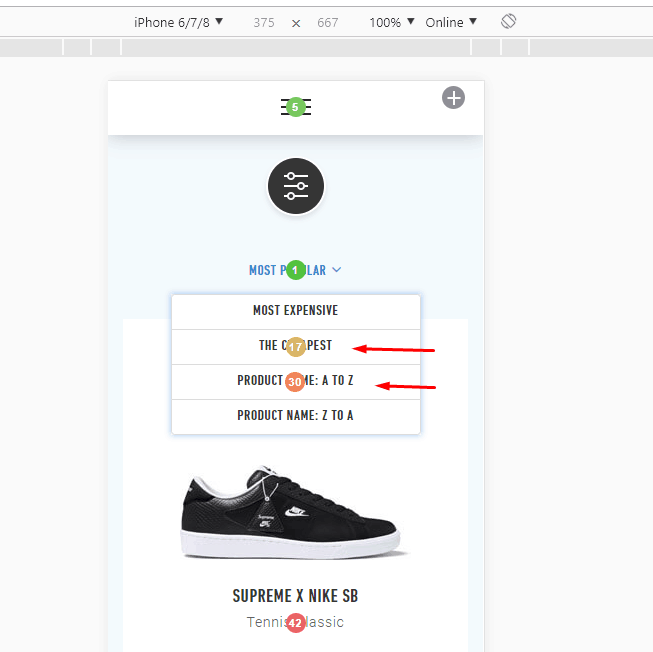
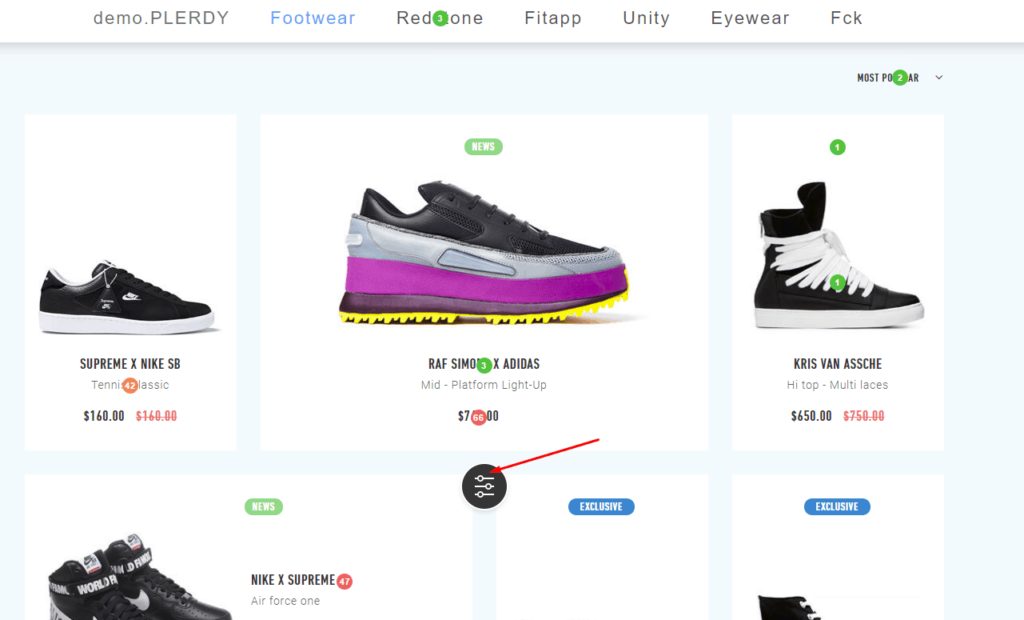
Many websites use dynamic elements, such as drop-down menus, pop-up forms, interactive objects, zoom after a cursor hover, etc.
Let’s compare Plerdy and Yandex.Metrica alternatives based on the example of a filter pop-up which opens after you interact with a floating button:
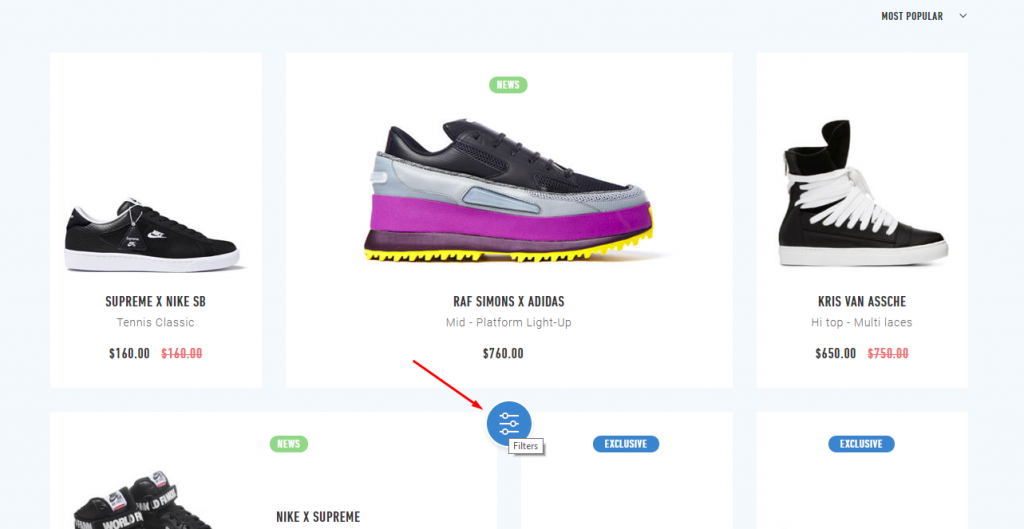
We need to check the clicks inside the pop-up form (to see which filters are the most popular), so we go to the form and make several clicks on different filters.
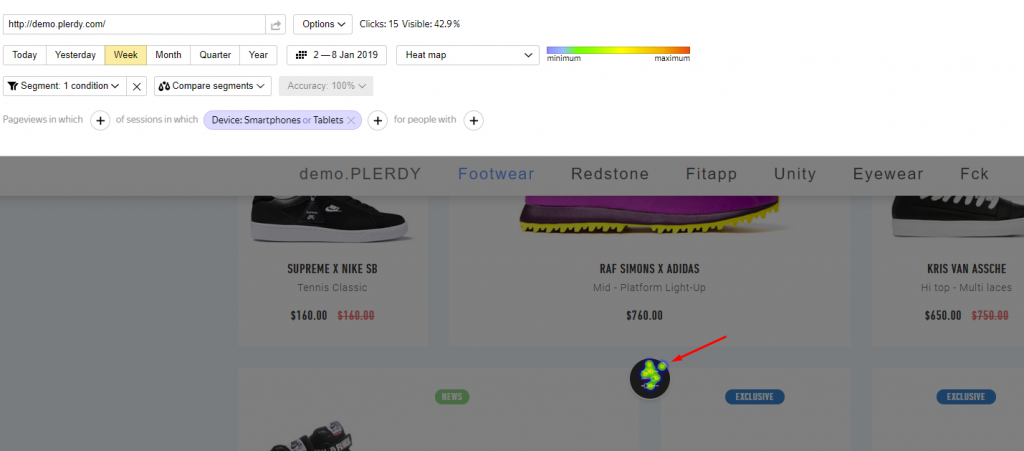
Here is the heatmap report of Yandex.Metrica:
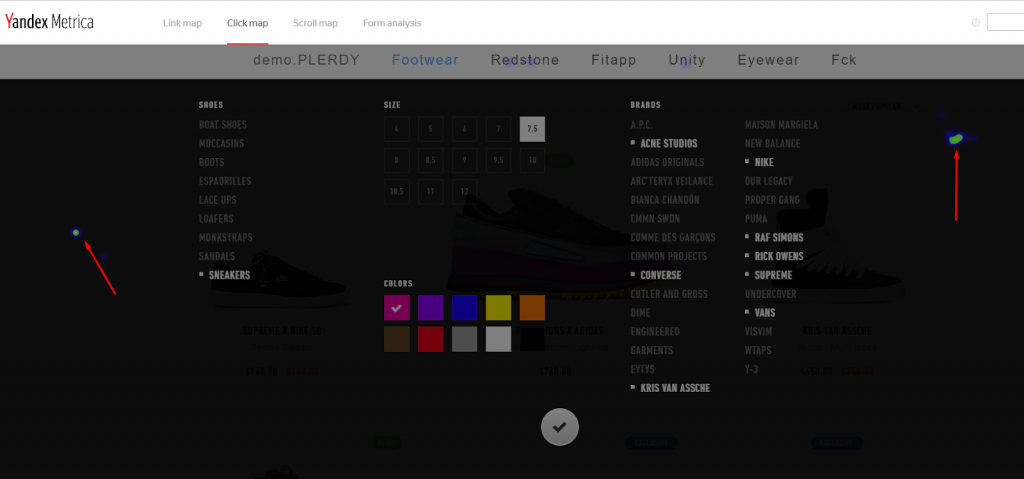
As you see, the tool displays the clicks on the main part of the page instead of the pop-up form that covers the whole page.
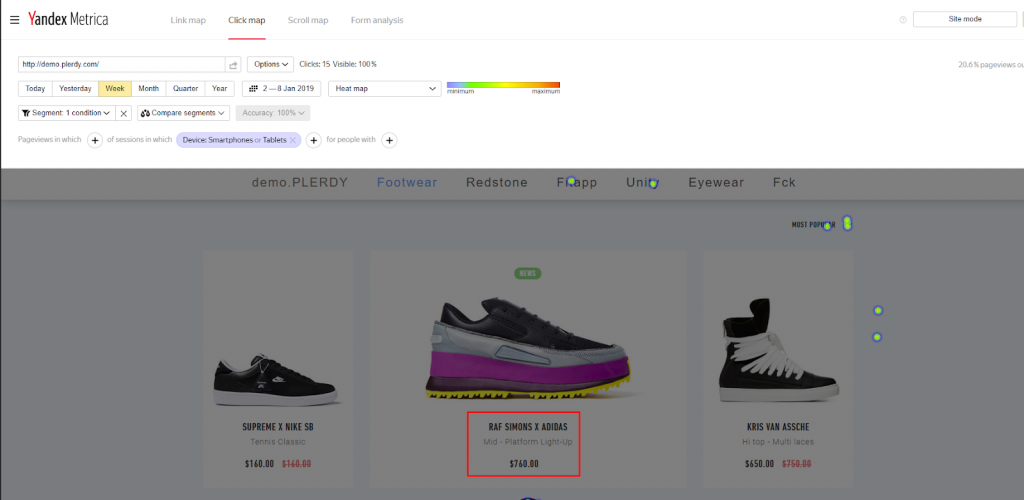
Now let’s open a similar report in Plerdy:
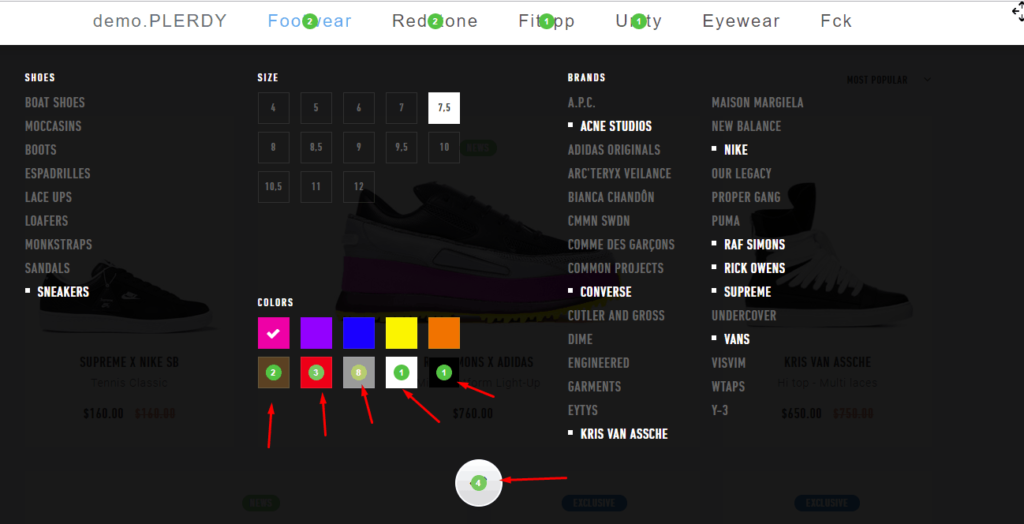
This report shows all the clicks on the filters.
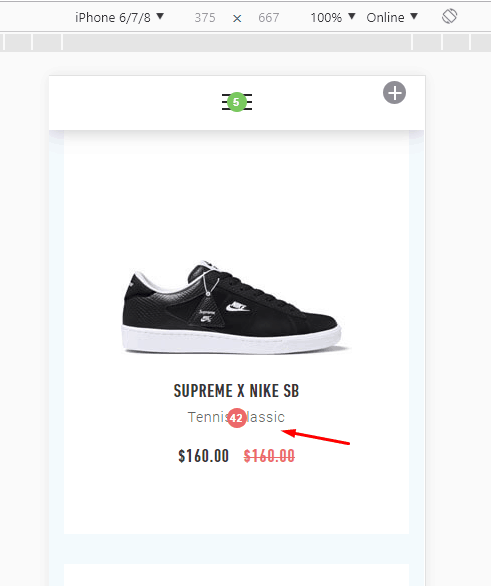
Another type of dynamic content is the text shown after hovering.

In the Yandex.Metrica dashboard, the data looks like this:

Let’s see how the same information is displayed in Plerdy heatmap software:
This tool has collected 31 clicks on the text that is only displayed after hovering.
Note that visitors clicked the text, not the image, in this case. No clicks would be shown if the text weren’t displayed (e.g., a user didn’t hover the element).
We have conducted a similar analysis in Hotjar. We have gone to a website page with several dynamic elements and clicked them:
The tool recorded the interaction with elements (buttons) but ignored everything next (e.g., opening a pop-up form, filter selection, etc.).
3. Data On Empty Clicks
Online marketers and UX specialists who have ever conducted usability audits know what an empty click is. It’s an accidental click made outside of the functional sections of a website. They are very difficult to interpret.
For example, in this part of the website, we have made several interactions that can be considered empty:
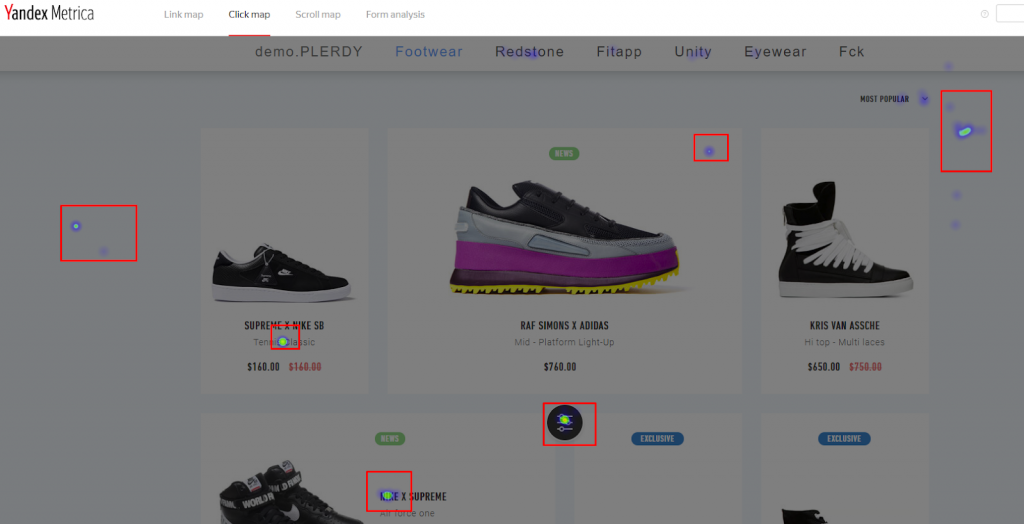
Let’s check the report in Yandex.Metrica heatmapping software:
You can see the empty clicks.
Now, we will try to open the same report but on the screen with a different resolution:
The data has considerably moved to the side. If a UX specialist has the same screen resolution, they may get confused about the CTR of the element.
Here is the same report opened on the third device with a screen resolution different from the previous two:
The dots of the clicks have shifted even more.
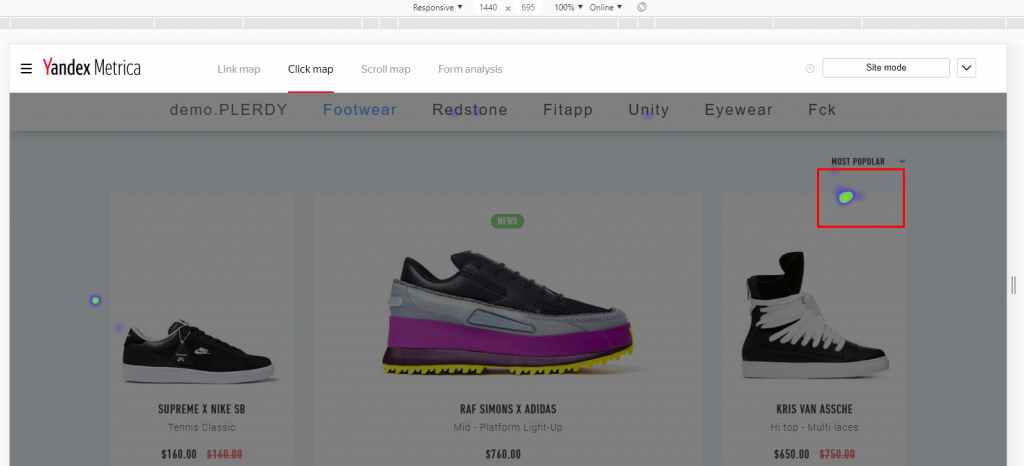
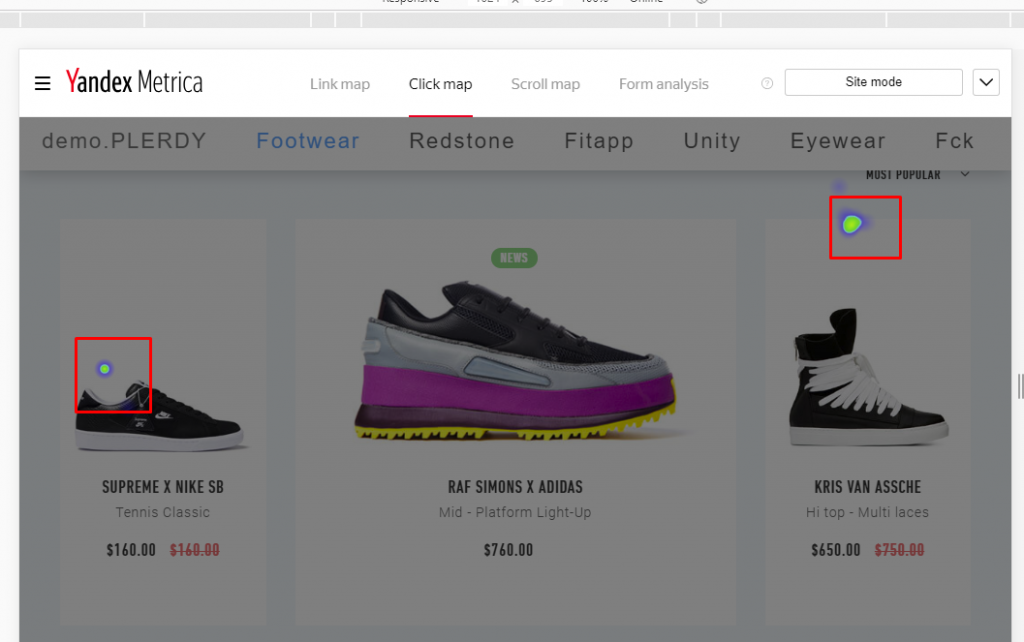
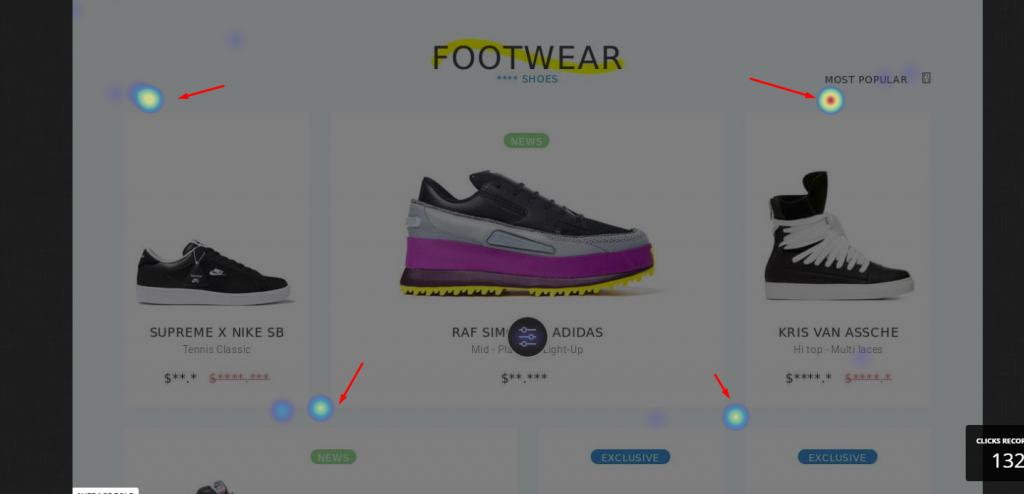
In the Plerdy dashboard, the results are displayed based on another principle. The clicks with no target action or intent are by default considered unimportant and not reflected:

You can also come across empty clicks in the Hotjar tool.
For example, while testing its dashboard in a mobile website version, we have noticed a click aside:

This interaction is useless since the action (in this case, several clicks in a row) was most probably accidental. It’s not a problem for a small website. Yet, a serious resource with huge traffic is a different story. If several thousands of visitors intentionally or unintentionally click a blind spot (a zone outside the functional area) or another place where interactions seem to make no sense, such data will have almost no value.
For instance, this data tells you nothing:

The main goal of Plerdy is to simplify website optimization.
Therefore, its heatmaps focus on interactions with critical elements that make up a website. Such information will be helpful to anyone working with web resources.
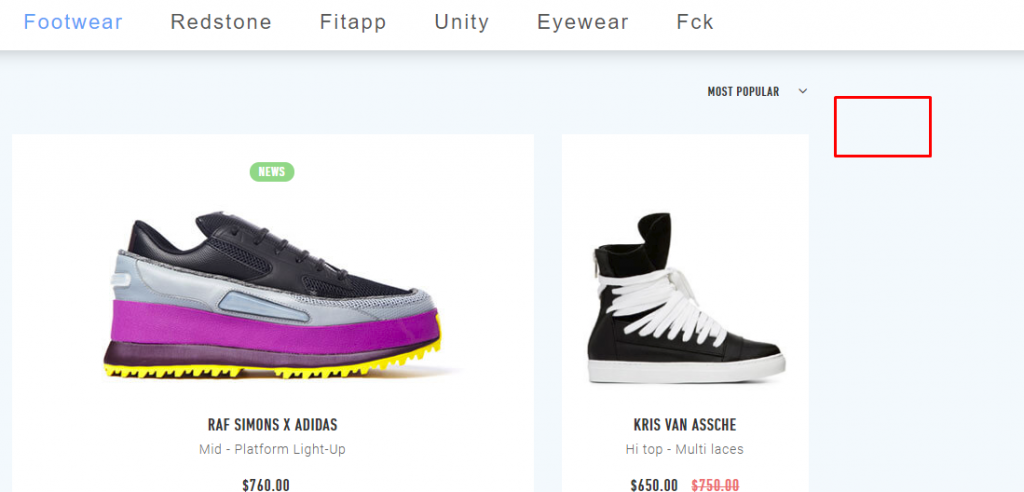
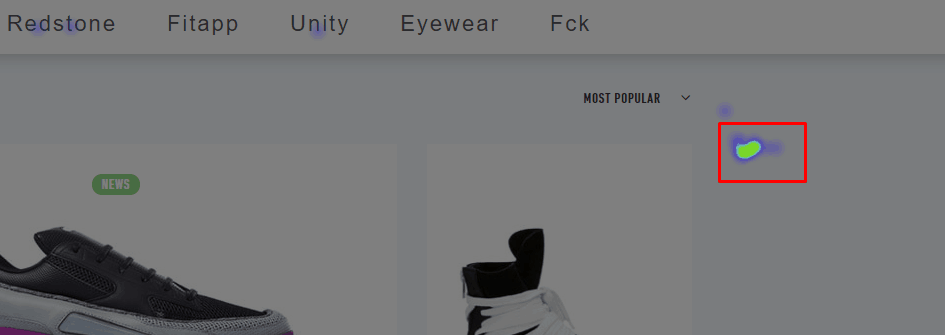
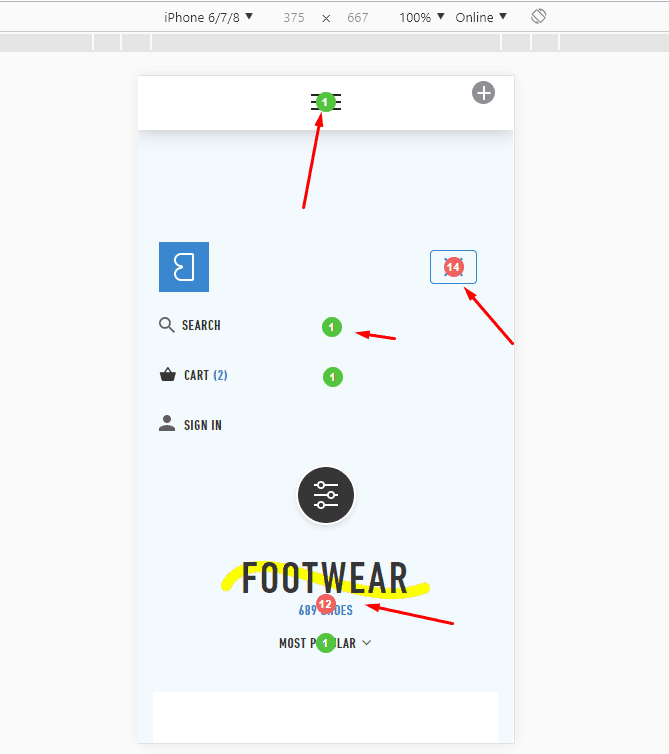
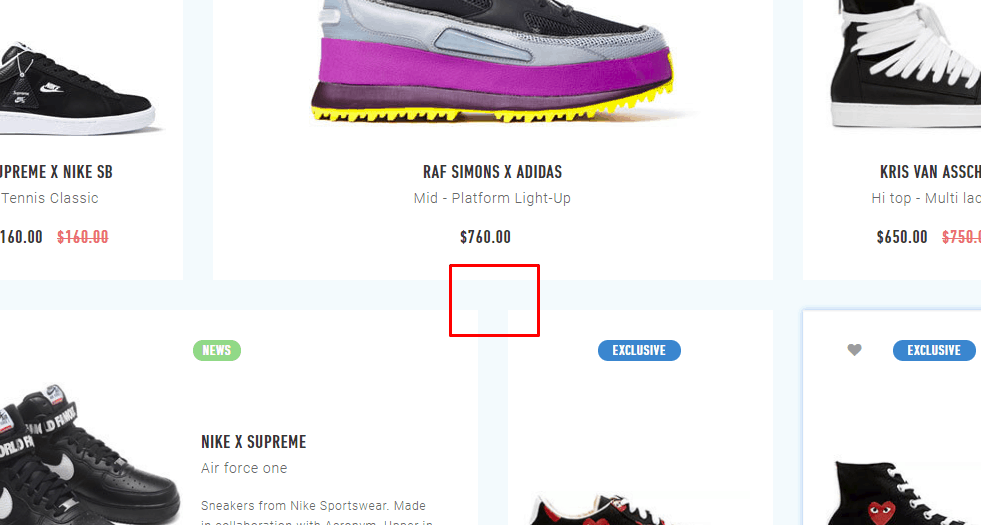
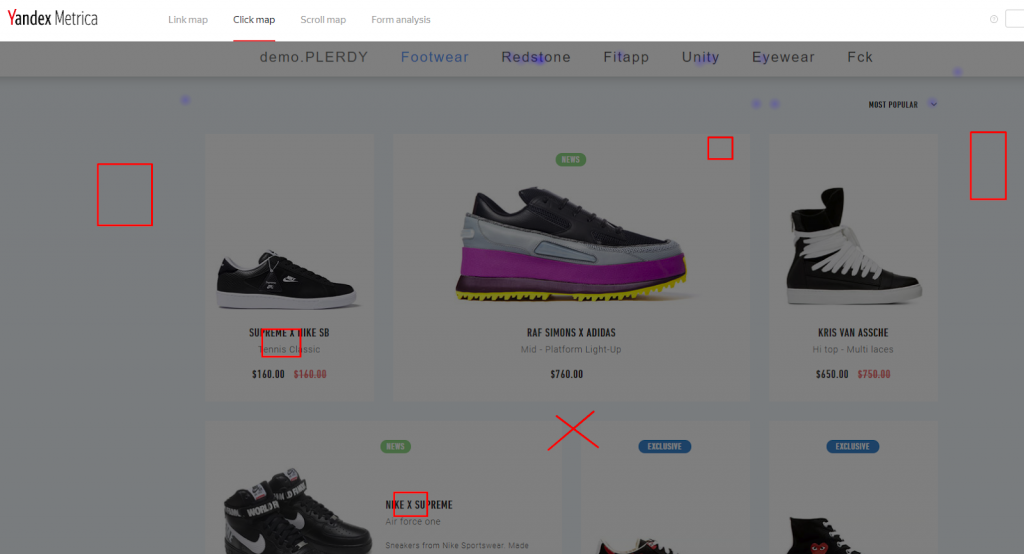
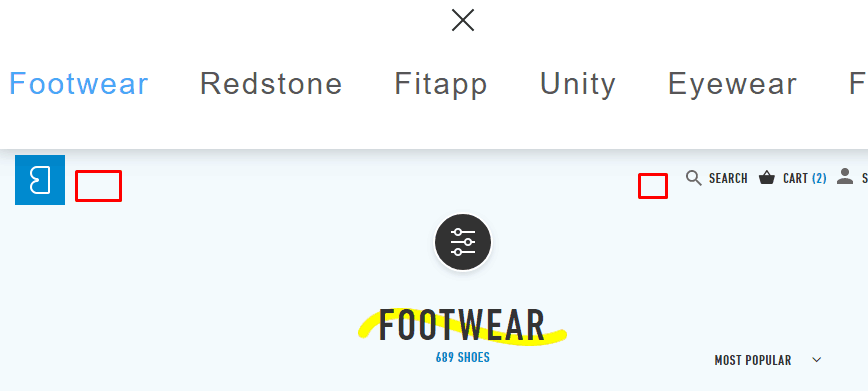
The next example proves the importance of this feature. We intentionally interact with inactive parts of the page (in the screenshot, these places are highlighted with red squares):
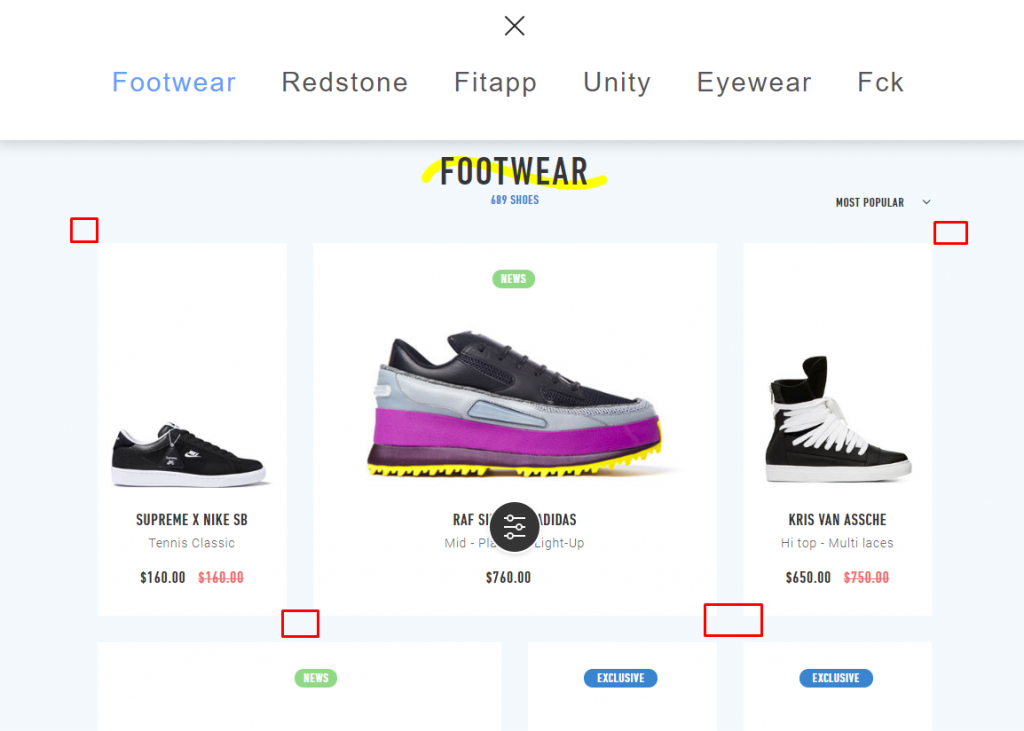
Now take a look at the results in Plerdy heatmap software:
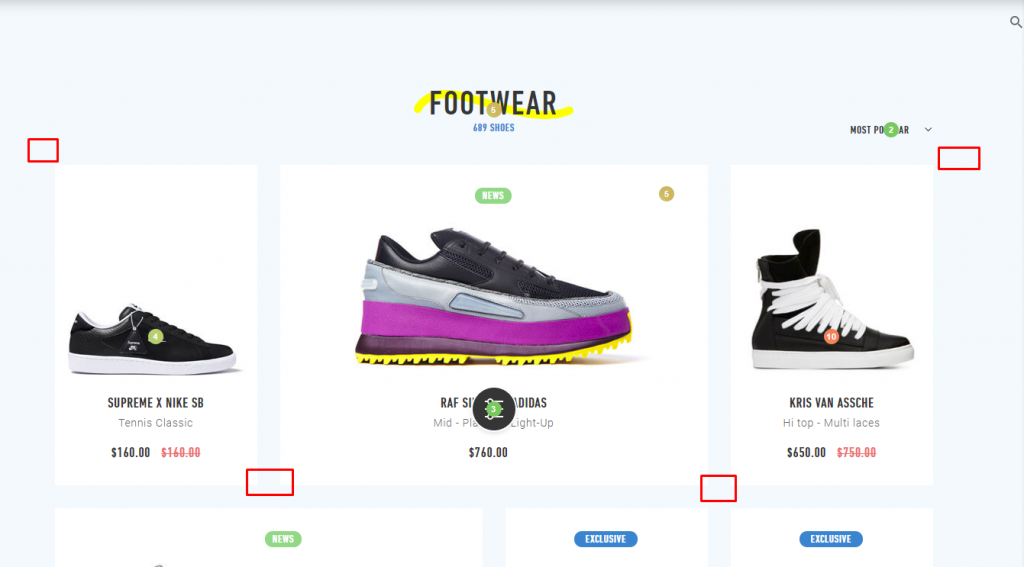
Since the interactions haven’t led to the target action, the tool automatically doesn’t display them.
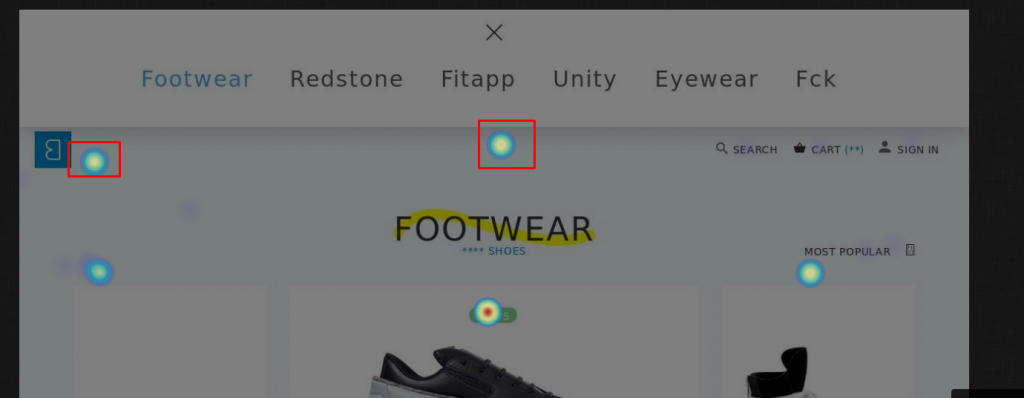
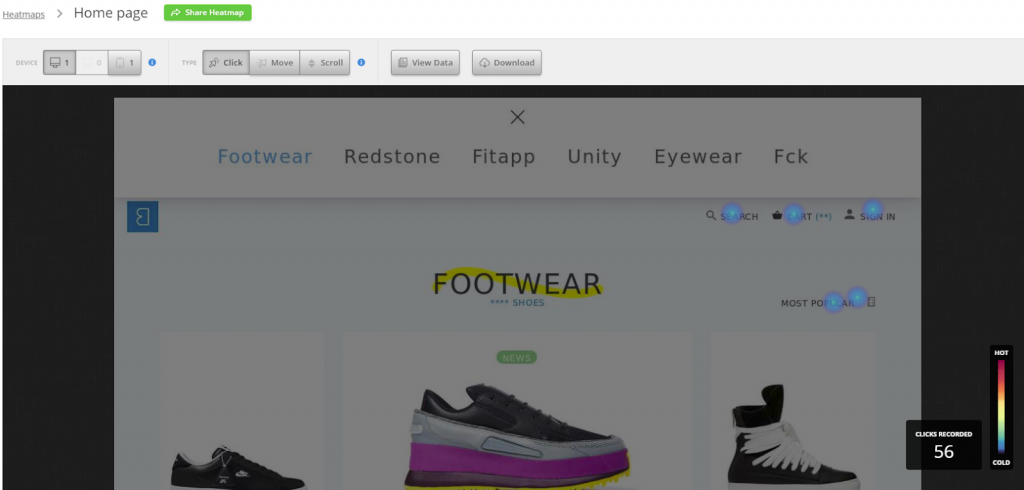
On the other hand, Hotjar software displays such data:
And adds it to the total number of website clicks:

4. Recording Clicks From Smartphones
The tracking of mobile clicks is the most important part of usability audits. In many industries, over 50% of traffic comes from smartphones.
Let’s compare reports in different heatmapping alternatives featuring the clicks made on a responsive website version. For example, we click this element:

After opening a report in Yandex.Metrica software, we see that the tool has recorded clicks but hasn’t properly segmented them. Although they were made on the responsive website version, the report looks like the visitors interacted with the main version:
Even if you go to other pages of the responsive version, the report will keep showing these clicks:
As you see, the coordinates of absolutely unrelated clicks, which were never made here, shifted to this page.
Generally, unlike its alternatives, Yandex.Metrica isn’t suitable for analyzing the behavior of smartphone users. After opening the mode for mobile devices in a browser, you’ll see this page:
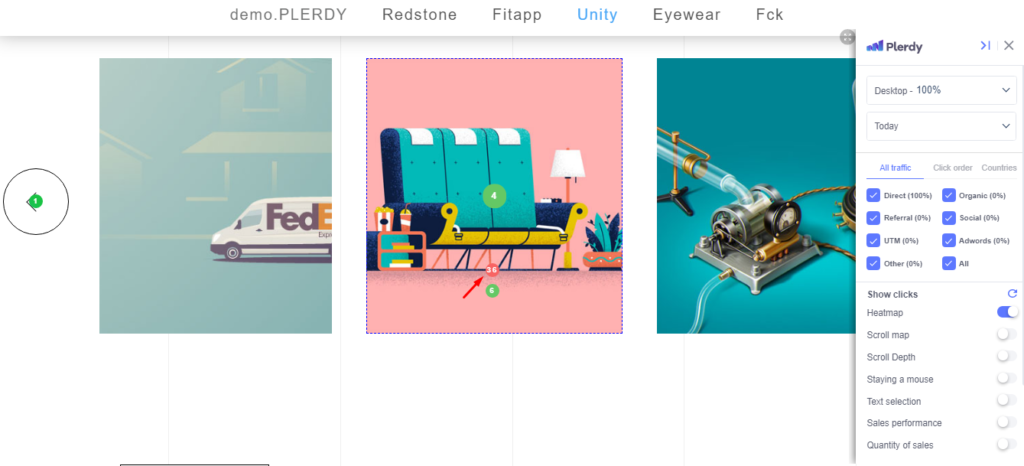
In the next window, we open a report generated by the Plerdy tool:
Even when you go to other pages of the responsive website version, the displayed data corresponds to clicks:
The dashboard also shows the ratio of clicks made on different device types:
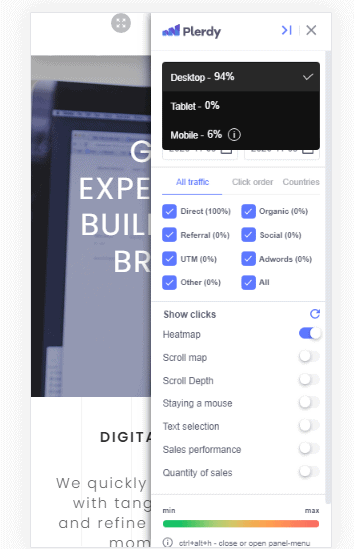
To conduct a full-fledged usability audit, it’s essential to segment the audience by device type. Thus, you must collect data on mobile and desktop clicks separately.
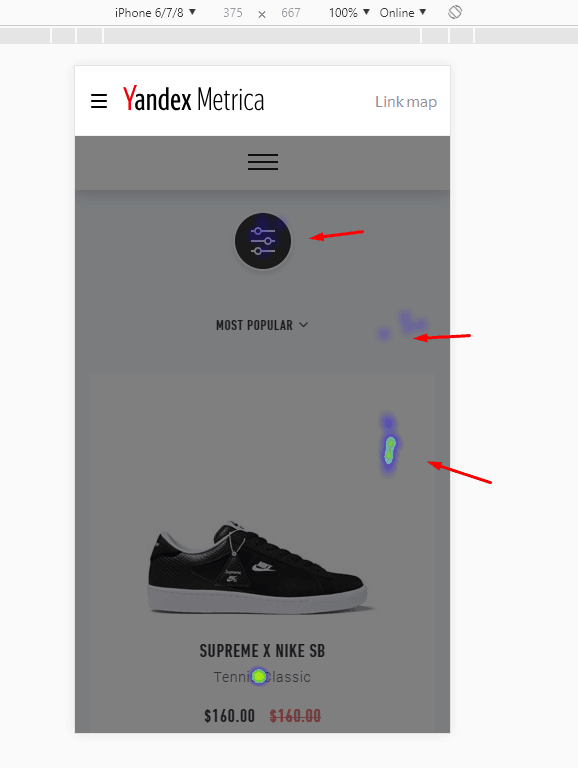
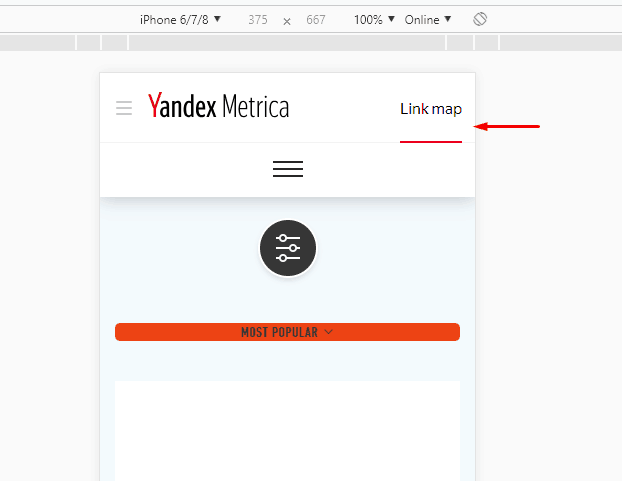
In Plerdy heatmap software, the navigation element with the filters hasn’t recorded mobile clicks:
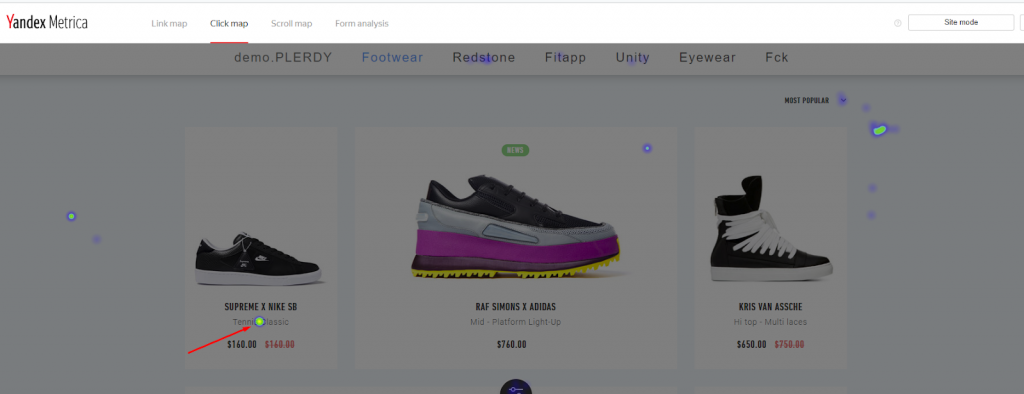
Whereas Yandex.Metrica software shows us that somebody has clicked the page:
The thing is that the Yandex.Metrica report mixes the actions completed on mobile devices and PCs. This element has a high CTR but is on the main website version.
Yandex.Metrica heatmapping software doesn’t display anything:
Here is the same page but with the results displayed in Plerdy heatmap reports:
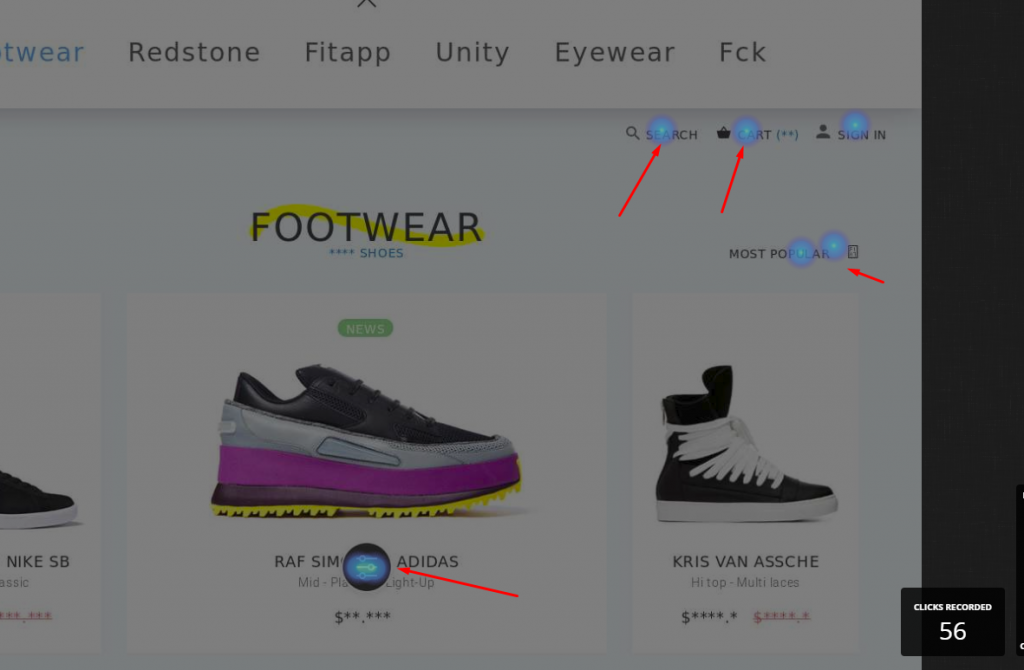
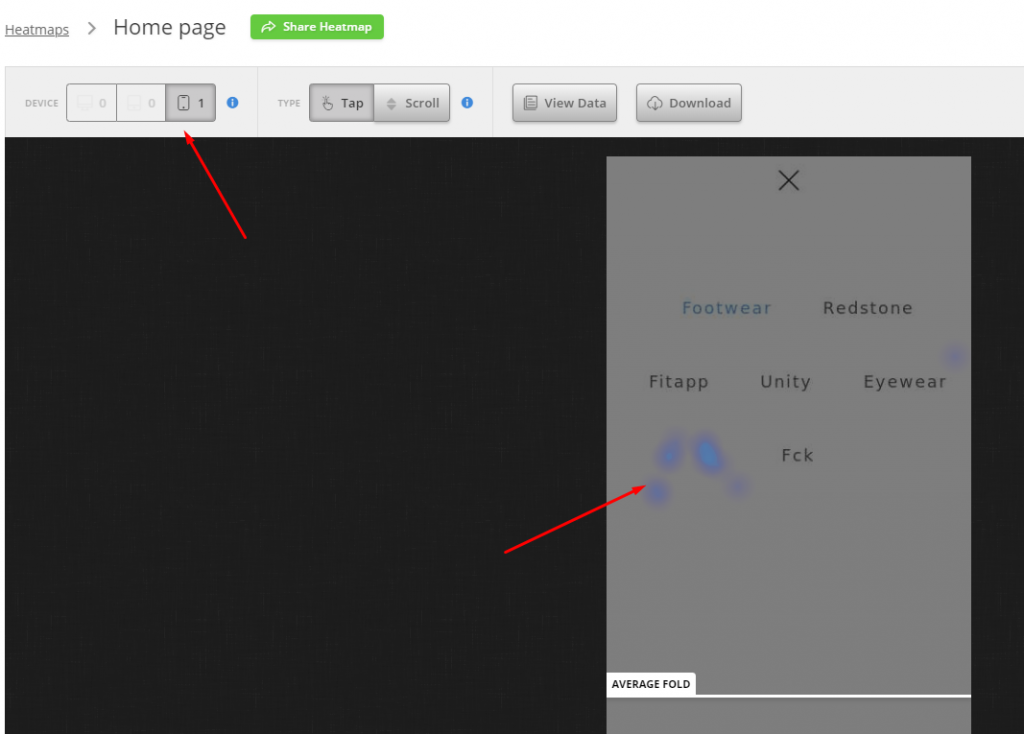
The next case clearly shows inaccuracies in Hotjar reports. The testing was made with the help of an iPhone.
The peculiarity of the tested website is that the dynamic menu opens by default. To continue, you need to close the drop-down window.
The heatmap tool captures only the first screen (opened with the drop-down menu) and adds clicks on the website.
You’ll have to figure out the nature of the interactions:
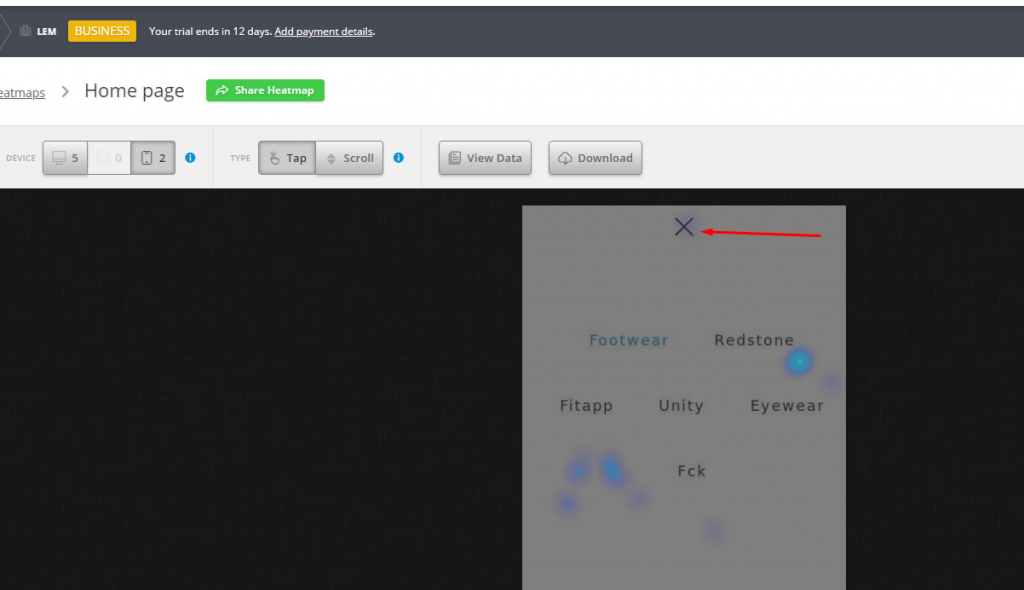
Just close the pop-up, and you will understand what the collected clicks are related to. Below is Plerdy heatmap:
As you can see, the pop-up overlaps the website content, which most probably points to an error on the analyzed website. Hotjar displays click based on the first screenshot and data pilling, whereas Plerdy shows everything in real-time, the best option.
Also, if you slightly scroll the page in Hotjar, the result will be as following:

The interactions are displayed, but you don’t see the elements they are related to. It’s because Hotjar uses screenshots. So if the menu is covered with another element during the page loading, the heatmap will be inaccurate and unclear.
5. Scroll Heatmap
The scroll heatmap feature helps determine how deep visitors scroll the page and where they interact. This solution is a combination of click heatmaps and scroll maps.
Here how it looks in Plerdy heatmap software:
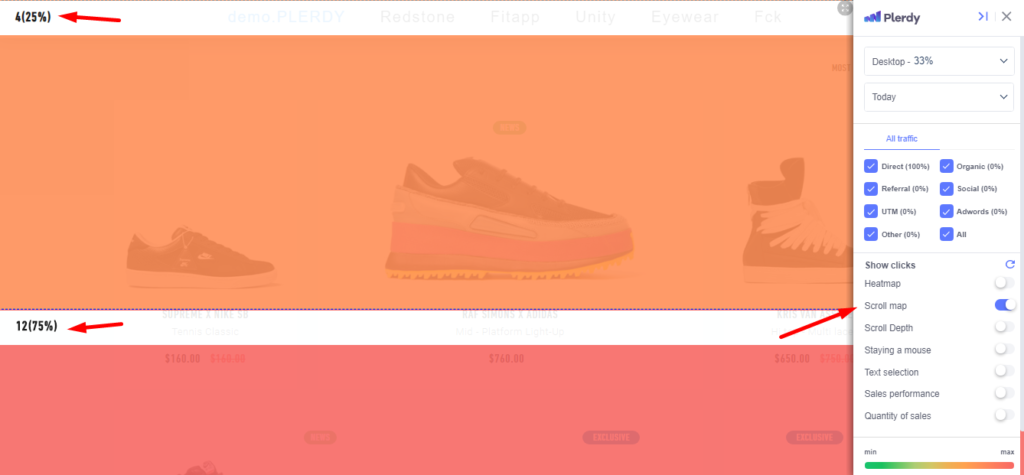
All data is instantly segmented by device type. Every page consists of 5 main segments. You can check the number of clicks within the selected segment in real-time (including the clicks from different traffic sources).
Yandex.Metrica and Hotjar don’t offer such a feature.
6. How User Behavior Data Is Displayed After Design Changes
Perhaps every online marketer or UX specialist uses Yandex.Metrica heatmap for audits has lost some information. That’s why heatmaps have become an additional rather than the main tool for usability audits.
Let’s see how you may lose data.
We will test the button that opens a filter:
Let’s delete it. In Plerdy heatmap tool, a click counter will automatically disappear:
In the Yandex.Metrica report, apart from the data on the deleted object, some other information disappears.
Here are the places where clicks are concentrated (before the deletion):
The result after the main element was deleted:
The Hotjar tool has a similar problem.
To see how the heatmap works, we select a website element that is going to be deleted:

We delete it and check the result in the Plerdy dashboard:

In Hotjar, the data is displayed without taking into account the changes:

We have also come across another issue that makes the report inaccurate.
The Hotjar report on the clicks on the responsive website version includes the interactions that were actually made on the main version (for PCs):
Such inaccuracies are caused by issues with processing data from different screen resolutions. As a result, click coordinates may shift.
For example, we made clicks in 2 zones:
And here is how Hotjar shows them:
7. Screen Recording of User Behavior
Record video sessions in Plerdy, more detailed information on the product page.
In Yandex.Metrica, this feature is provided by Webvisor – a tool that records a video of a session. Online marketers and UX specialists know about such a solution but don’t usually use it. Why?
Everything depends on the actual traffic to a website. If you have 10 visitors per day, the number of videos will be relatively small. You can easily watch them detect anomalies in user behavior. Analyzing such information is much more difficult when traffic reaches several thousand (or even dozens and hundreds or thousands) of monthly visitors. You will waste time watching the videos or limit yourself to several recordings.
The situation becomes even tougher when a session lasts for one minute or longer. For example, to view 1000 one-minute videos, you’ll need 16 hours (or 2 working days)…
8. How Are Heatmaps Displayed
Each of the analyzed alternatives has a different type of report. Unfortunately, online marketing and design beginners usually don’t pay attention to this.
For example, if you decide to use the heatmap offered by Hotjar, you will get a screenshot of the analyzed page with a heatmap layer added on top:
You won’t be able to navigate between the website pages freely.
In Plerdy heatmap, you navigate between the pages online, and the data is displayed in real-time. Just turn on a sidebar to display a heatmap.
Conclusion
Obviously, it’s not always appropriate to compare Yandex.Metrica, Hotjar, and Plerdy. Yandex.Metrica is an analytics system; Hotjar is currently more focused on developing a feedback widget. Plerdy perfects click heatmaps that may be equally useful for an online marketer, UX specialist, or SEO expert.
Of course, users are the ones to decide. So leave your comments and suggestions right under this post. We are curious to know what you think about the strengths and weaknesses of these best heatmapping alternatives.