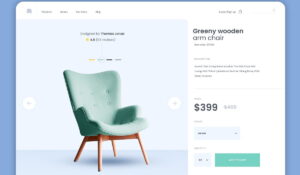
User Experience (UX) SEO And UX For SaaS Websites: How To Turn Organic Traffic Into Product Signups Jun 08, 2026
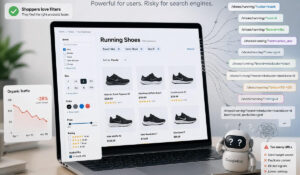
Digital marketing Blog Scale Your Competitor Analysis: How to Gather Real-Time Market Data Without Bans Jun 05, 2026