

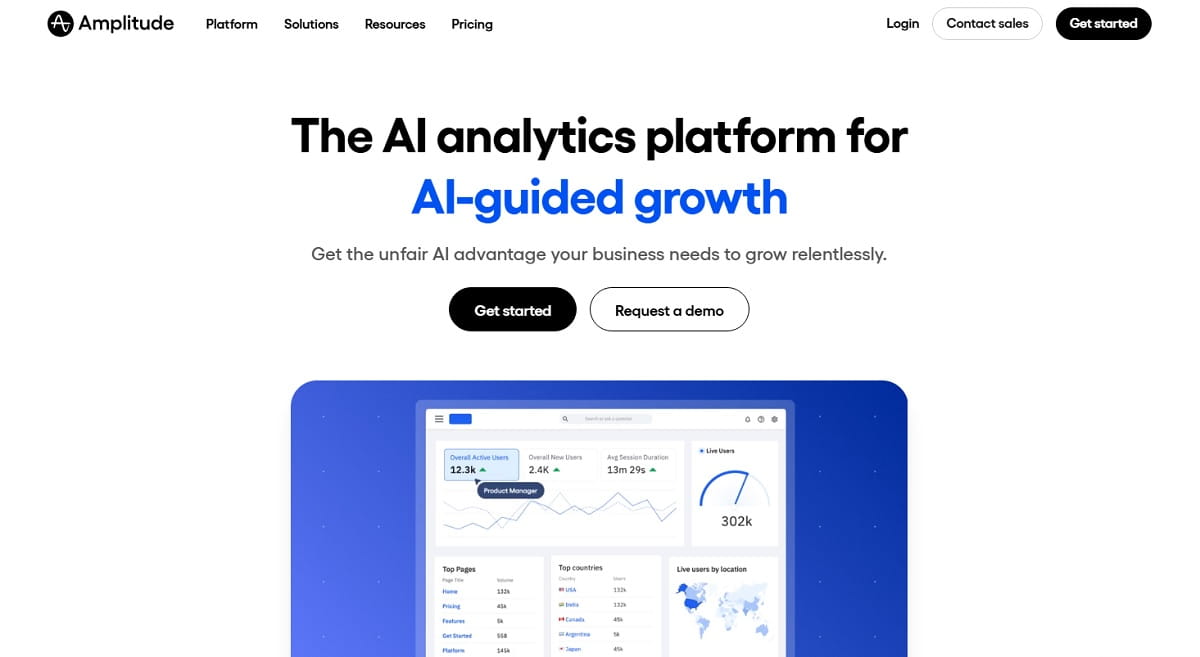
Most teams do not start shopping for Amplitude alternatives because the product is bad. They start because the bill grew faster than the insight, because the event taxonomy turned into a swamp nobody owns, or because the only three people who can build a funnel report are all on the data team. Amplitude is a serious product analytics platform — it is also a platform that now spans analytics, session replay, experimentation, guides, surveys and Voice of Customer, and that breadth is exactly what pushes some teams to look elsewhere.
This guide compares 12 tools that can genuinely take over part or all of Amplitude’s job, with current pricing, honest trade-offs, and the sub-intent each one serves. We open with Plerdy, because a large share of teams searching for Amplitude alternatives do not actually need a mobile-SDK product analytics warehouse — they need to see where users click, hesitate and drop off on a website, then fix it. Plerdy combines heatmaps, session replay, event tracking and funnel analysis in one place, at a price that does not require a procurement cycle.
One more reason this list looks different from the ones you have already read: the Amplitude landscape changed materially in 2025–2026. Two tools that appear on most “best Amplitude alternatives” articles are no longer alternatives at all — they are now part of Amplitude. We cover that in a dedicated section below.
Table Of Contents
- Why Teams Look For Amplitude Alternatives In 2026
- What Changed In Amplitude’s Orbit In 2025–2026
- How We Picked These Amplitude Alternatives
- Amplitude Alternatives At A Glance
- The 12 Best Amplitude Alternatives
- Amplitude Vs The Alternatives: Feature Comparison
- Tools That Are No Longer Amplitude Alternatives
- How To Choose The Right Amplitude Alternative
- How To Migrate Off Amplitude Without Losing Your History
- Common Mistakes When Switching Analytics Platforms
- Frequently Asked Questions
Why Teams Look For Amplitude Alternatives In 2026
Across review sites and community threads, the reasons cluster into four repeatable complaints. None of them are “Amplitude cannot do the analysis” — they are all about cost, effort and fit.
1. Pricing Moved To Events, And Events Are Hard To Forecast
Amplitude’s public pricing is now event-based rather than MTU-based: the Free plan covers 2 million events per month, Plus starts at $0 and scales to roughly 70 million events, and Growth and Enterprise are custom quotes, according to Amplitude’s pricing page. Event-based billing is fairer for products with few but very active users — and punishing for products instrumented at autocapture-style granularity. A single chatty component can move you a tier.
Note that many older comparison articles still describe Amplitude in MTU terms. If a list you are reading quotes MTU tiers, it is describing a pricing model Amplitude has moved on from, and its cost estimates are stale.
2. The Learning Curve Is Real
Amplitude rewards teams that already think in events, properties and cohorts. Teams that do not have that vocabulary tend to plateau on dashboards someone else built, then quietly stop opening them. This is the single most cited frustration in public reviews of the product, and it is why “easier alternative” is such a common phrasing in this search.
3. Event Taxonomy Becomes A Second Job
Manual event definition means someone must own naming, versioning, deprecation and QA. Without that owner, six months in you have “signup_complete”, “Signup Completed” and “user_signed_up” all firing into the same property. Autocapture platforms such as Heap, Fullstory and PostHog exist largely to remove this failure mode.
4. You Only Needed A Slice Of It
Plenty of teams buy a full product analytics suite to answer questions like “why does checkout lose people at the shipping step” — a question that heatmaps, session replay and a three-step funnel answer faster and cheaper. If that describes you, a behavior analytics tool is not a downgrade; it is the correct instrument. Our guide to conversion funnel optimization walks through that workflow end to end.
What Changed In Amplitude’s Orbit In 2025–2026
This is the part almost every competing article gets wrong, because most of them were published before the moves below. If you are evaluating Amplitude alternatives in 2026, three of these directly change your shortlist.
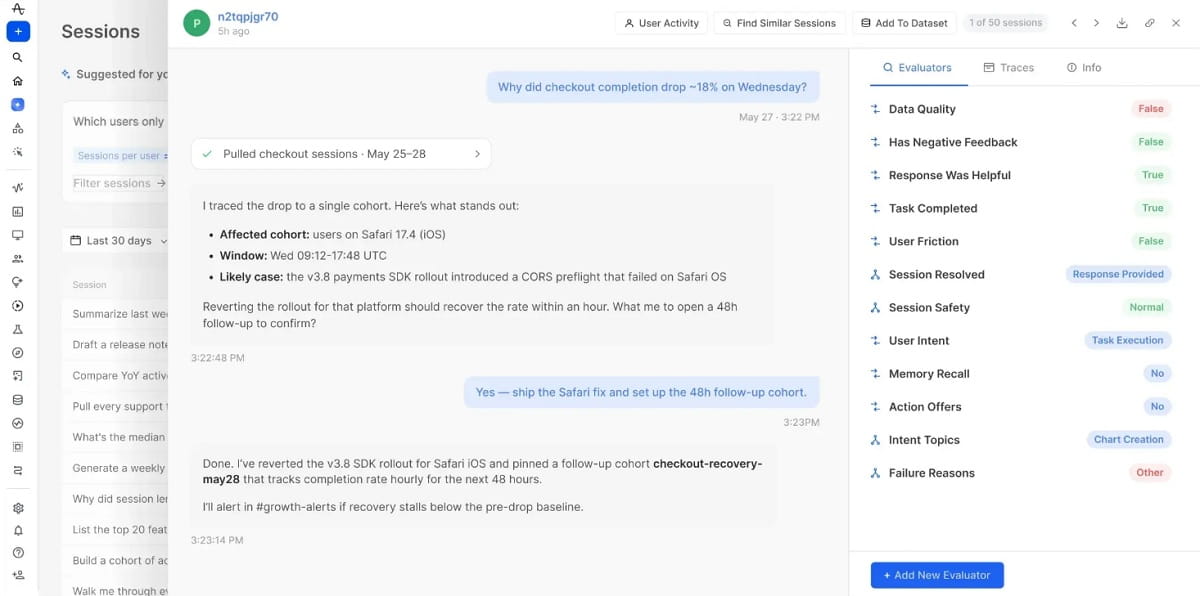
- Amplitude acquired Command AI (announced 2024), adding in-app guides, product tours, onboarding checklists, announcements and surveys to the platform, per Amplitude’s announcement. This narrowed the gap with Pendo and Userpilot.
- Amplitude acquired Kraftful on 10 July 2025 — an AI-native Voice of Customer startup — to fold qualitative feedback analysis in alongside quantitative behavioral data (Amplitude, Business Wire).
- June.so wound down on 8 August 2025 after its founding team joined Amplitude, as the June team explained in their own farewell post. June was the standard recommendation for “simple B2B SaaS analytics” on older lists. It is no longer selectable.
- OpenAI acquired Statsig for a reported $1.1 billion in September 2025, naming founder Vijaye Raji CTO of Applications (OpenAI, TechCrunch).
- Amplitude took on the Statsig brand and customer base on 5 May 2026. Amplitude states it will “maintain and develop the current Statsig platform across the cloud and data warehouse, including support for existing customers,” while working with the Statsig team that remains at OpenAI through the transition (Amplitude). The Statsig homepage now describes the product as “part of the Amplitude family.”
The practical takeaway: Statsig is no longer an Amplitude alternative — choosing it is choosing Amplitude. Any list that still ranks Statsig as an escape route is out of date. That deal also removed one of the strongest independent experimentation platforms from the market, which raises the value of PostHog and other open options for teams that want feature flags plus analytics without concentrating everything with one vendor.
How We Picked These Amplitude Alternatives
Being a good analytics tool is not the same as being an Amplitude replacement. We applied four filters, and several well-known names failed them.
- It must replace a core Amplitude job. The tool has to cover behavioral event tracking plus at least one of: funnels, retention and cohort analysis, or user journey and path analysis. Tools that only run surveys, only do tag management, or only draw dashboards on someone else’s data were excluded.
- Status verified on the vendor’s own site, in 2026. Every product below was checked against its official homepage and pricing page — not against older listicles. That is how Statsig and June came off this list rather than onto it.
- Pricing must be published or honestly labelled as custom. Where a vendor publishes numbers, we quote them. Where a vendor does not, we write “custom quote” instead of inventing a figure.
- The sub-intent has to be named. A privacy-first self-hosted tool and an enterprise journey analytics suite are both “alternatives,” but not to the same buyer. Each entry states who it is genuinely for and where it stops.
Where a tool is a specialist rather than a like-for-like swap, we say so in its entry. That is more useful than 12 products all described as “the perfect Amplitude replacement.”
Amplitude Alternatives At A Glance
| Tool | Best For | Free Tier | Entry Paid Price | Deployment |
|---|---|---|---|---|
| Plerdy | Web and ecommerce behavior plus conversion | Yes, free forever | $32/mo ($21 annual) | Cloud |
| Mixpanel | Closest like-for-like product analytics | 1M events/mo | Volume-based from $0 | Cloud |
| PostHog | Engineering-led teams wanting one stack | 1M events/mo | Usage-based | Cloud or self-host |
| Heap by Contentsquare | Autocapture without event planning | 10k sessions/mo | Custom session pricing | Cloud |
| Pendo | Analytics plus in-app guidance | 500 MAU | Custom quote | Cloud |
| Fullstory | Session-led digital experience analytics | 30k sessions/mo | Custom quote | Cloud |
| Google Analytics 4 | Free cross-channel web and app analytics | Yes, full product | GA 360 from about $50k/yr | Cloud |
| Adobe Analytics | Enterprise multi-channel journey analytics | No | Custom quote | Cloud |
| Matomo | Privacy-first analytics and data ownership | On-Premise free forever | Cloud from €29/mo | Cloud or self-host |
| CleverTap | Mobile analytics plus engagement | 30-day trial | $85/mo (Core) | Cloud |
| Countly | Self-hosted product analytics | Countly Lite | $175/mo (Flex) | Cloud or self-host |
| Snowplow | Warehouse-native behavioral data | 14-day trial | Custom quote | Self-host or managed |
Prices are the vendors’ published figures as of 2026, excluding tax. Custom-quote products are marked as such rather than estimated.
The 12 Best Amplitude Alternatives
1. Plerdy — Best For Web And Ecommerce Behavior Analytics
- Class: specialist alternative. Plerdy replaces Amplitude for the “understand and fix on-site behavior” job, not for deep mobile-SDK cohort modeling.
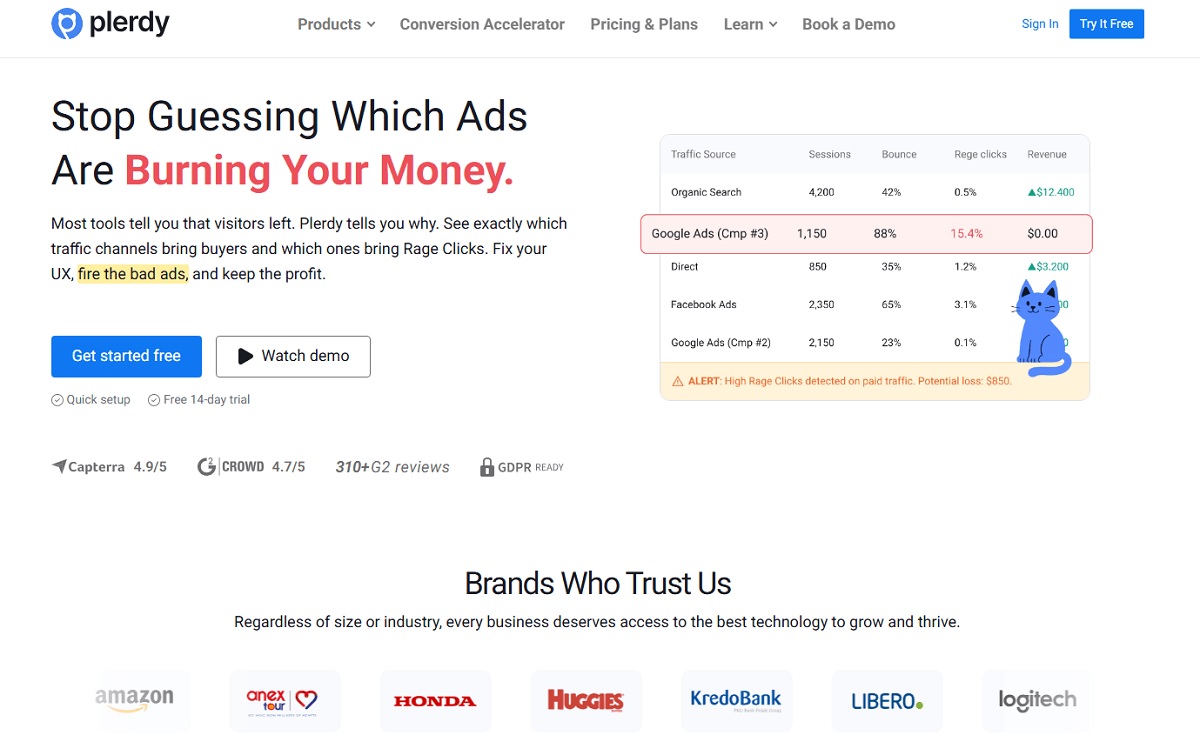
Plerdy is a conversion rate optimization and behavior analytics suite for websites and online stores. Where Amplitude answers “which cohort retains best,” Plerdy answers “which element on this page kills the conversion, and what does the session look like when it happens.” For a large share of teams that arrive at this search, that is the actual question — and the tooling to answer it costs a fraction of a product analytics contract.
The suite is unusually broad for the price: click, scroll and hover heatmaps, session replay with rage-click detection, custom event and goal tracking, multi-step funnel analysis, ecommerce revenue tracking, A/B testing, NPS and feedback widgets, form analytics, an error tracking tool and an SEO checker — all under one tag and one bill.
Key Features
- Click, scroll, hover and attention heatmaps segmented by device, traffic source and date range
- Session replay with rage clicks, dead clicks and error events surfaced in the timeline
- Custom event and goal tracking configured in the interface, without a developer release
- Website funnel analysis with drop-off percentages at each step and replay links per step
- Ecommerce analytics tying product views, add-to-cart and purchase revenue to on-page behavior
- A/B testing, pop-ups, NPS surveys and feedback forms, so the fix ships from the same tool as the diagnosis
- SEO checker and SERP tracking, which no dedicated product analytics platform offers
Use Cases
- Diagnosing checkout and lead-form abandonment on ecommerce and SaaS marketing sites
- Validating a redesign by comparing heatmaps and funnel steps before and after release
- Finding UX friction that event data alone cannot explain — mis-tapped elements, invisible CTAs, broken sticky headers
- Running the diagnose-then-test loop in one platform instead of stitching three subscriptions together
Pros
- Genuinely free forever tier, not a time-limited trial
- Paid entry at $32/month makes it viable for teams that cannot justify a product analytics contract
- Quantitative and qualitative data in one interface, so a funnel drop links straight to the recordings behind it
- Setup is a single script; no event taxonomy design required before you see value
Cons
- Not a mobile-SDK-first platform; native iOS and Android product analytics is not its centre of gravity
- Retention and cohort modeling is lighter than Amplitude’s — if your core metric is week-8 retention by acquisition cohort, pair Plerdy with a product analytics tool rather than replacing one
- No feature-flag or server-side experimentation layer
Pricing — Free forever plan (100 heatmaps per day, 500 video sessions, 5,000 SEO audit pages, unlimited A/B testing, 1 month storage). Startup $32/month, or $21/month billed annually. Scale $64/month, or $42/month annually. Thrive $108/month, or $70/month annually. Enterprise tiers run $149 to $390/month, discounted to $97–$253 annually. Current figures on the Plerdy pricing page.
Best For — marketing, growth, CRO and ecommerce teams whose money is made or lost on a website, and who need behavior evidence rather than a data warehouse.
2. Mixpanel — Best Like-For-Like Product Analytics Replacement
- Class: direct replacement.
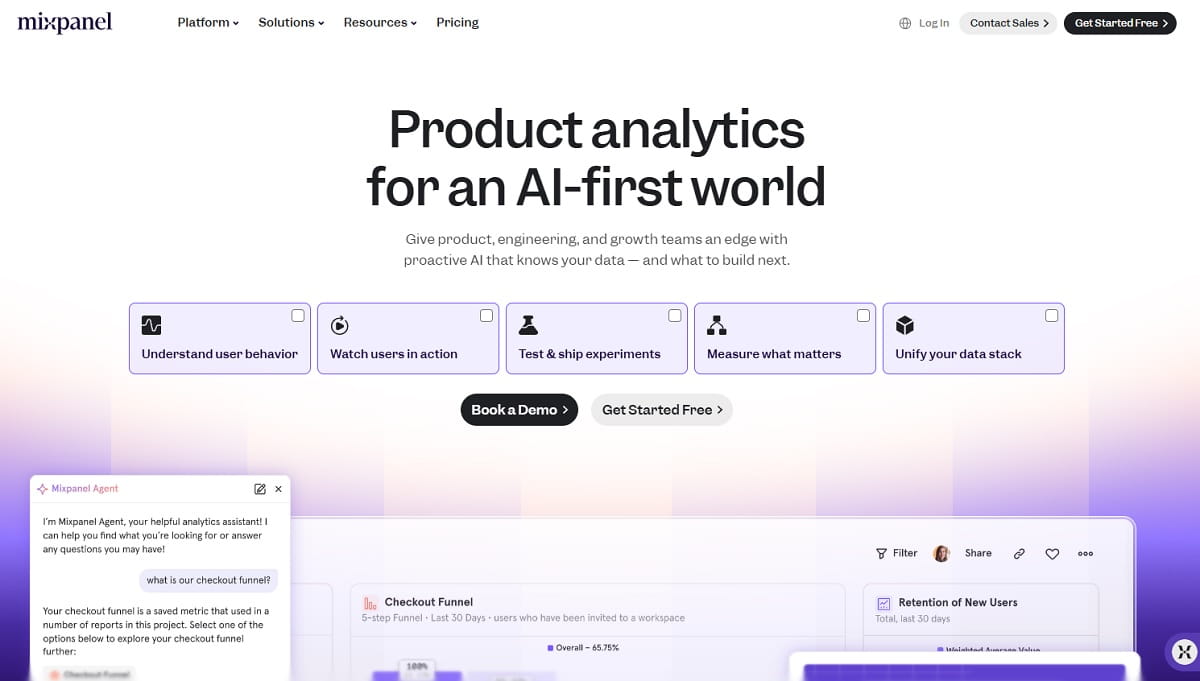
Mixpanel is the closest one-to-one swap on this list. It covers the same primitives Amplitude is built on — events, user profiles, funnels, retention, flows, cohorts — with an interface most product managers describe as faster to learn. Teams migrating typically map their existing event schema across and rebuild their core reports in days rather than weeks.
Key Features
- Funnel, retention, flows and impact reports with segmentation on any event or user property
- Session replay bundled into the analytics workflow rather than sold as a separate product
- Warehouse connectors for BigQuery, Snowflake and Redshift, in both directions
- Board-level dashboards with alerts, plus a natural-language query layer
- Mature SDK coverage across web, iOS, Android and server-side
Use Cases
- Product teams tracking activation, feature adoption and retention on a subscription product
- Growth teams running cohort comparisons across acquisition channels
- Teams that outgrew GA4’s event model but do not want an enterprise contract
Pros
- Generous free tier at 1 million events per month, enough for a real early-stage product
- Reporting UI is consistently rated easier than Amplitude’s for non-analysts
- Startup program gives eligible early-stage companies their first year free
Cons
- Still requires deliberate event taxonomy design — it does not autocapture by default
- Experimentation and feature flags are not native; you will pair it with another tool
- Costs scale on the same event axis that made Amplitude expensive, so a chatty implementation stays expensive
Pricing — Free up to 1 million events per month. Growth starts at $0 on volume-based pricing up to 20 million events per month. Enterprise is a custom quote scaling to 1 trillion events. See Mixpanel pricing. If you are weighing the two head to head, our Amplitude vs Mixpanel comparison goes deeper on API, segmentation and cost.
Best For — product teams that want Amplitude’s analysis model with a shorter ramp and a real free tier.
3. PostHog — Best For Engineering-Led Teams Wanting One Stack
- Class: direct replacement.
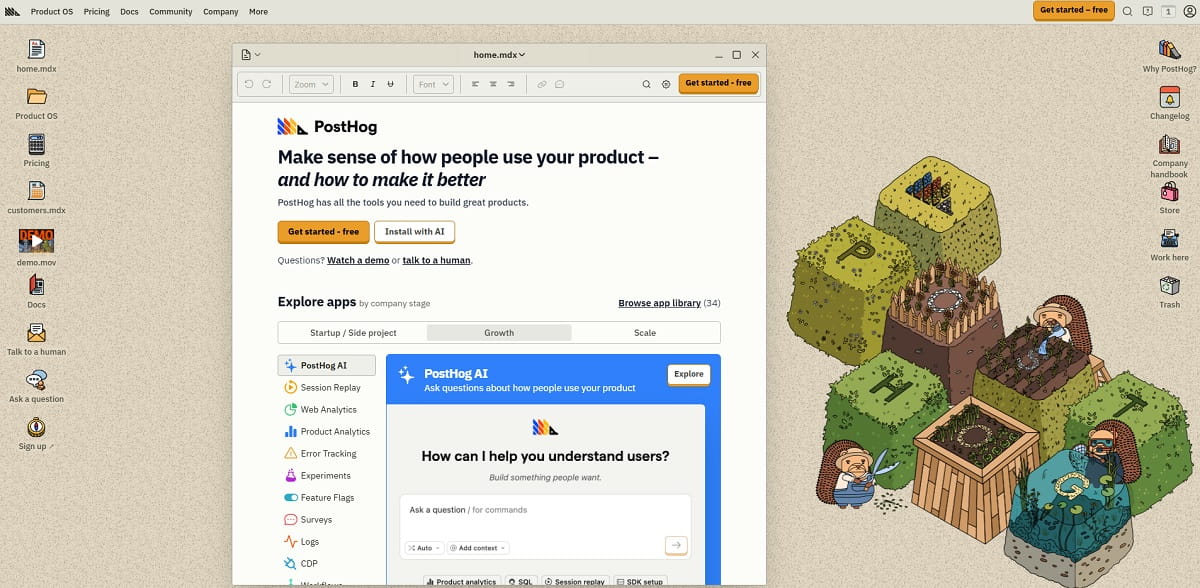
PostHog bundles product analytics, session replay, feature flags, experiments, surveys, error tracking and a data warehouse into a single platform with source-available code and a self-host option. Since the Statsig deal removed a major independent experimentation vendor, PostHog is now the most obvious way to keep analytics and feature flagging under one roof without that roof being Amplitude’s.
Key Features
- Product analytics with autocapture plus explicitly defined custom events
- Feature flags and A/B experiments driven by the same event data
- Session replay, surveys, error tracking and AI observability in the same workspace
- Built-in data warehouse and pipelines, so you can query raw events with SQL
- Self-hosting available for teams with data-residency constraints
Use Cases
- Engineering-heavy startups consolidating four analytics subscriptions into one
- Teams that want to ship a flag, measure its impact and watch the replay without leaving the tool
- Organizations that need event data to stay inside their own infrastructure
Pros
- 1 million events per month free, with usage capped at the free tier so you cannot be surprise-billed
- Breadth is unmatched at this price point — analytics plus flags plus replay plus warehouse
- Transparent, public, usage-based pricing
Cons
- The surface area is large; non-technical users often need a guided onboarding
- Self-hosting is real work — most teams end up on PostHog Cloud anyway
- Autocapture volume can inflate event counts if you do not prune
Pricing — Free tier includes 1 million events per month with no credit card; paid usage is metered per product. See PostHog pricing.
Best For — technical product teams that would rather run one platform than integrate five.
4. Heap by Contentsquare — Best For Autocapture Without Event Planning
- Class: direct replacement.
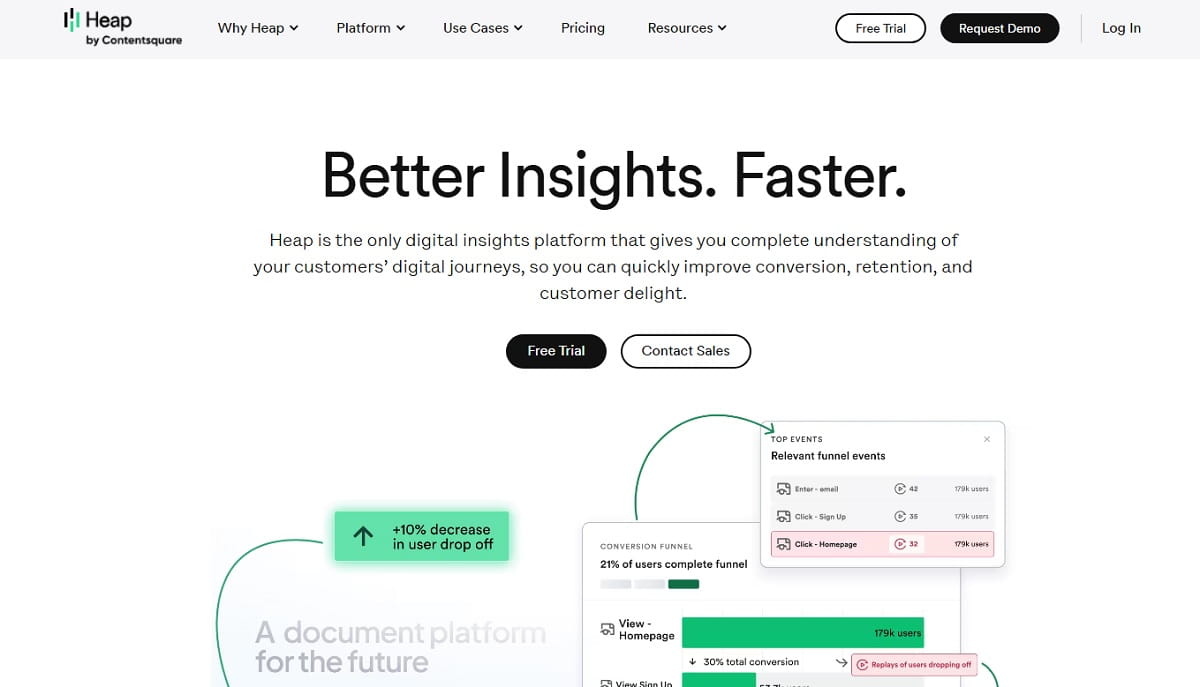
Heap’s pitch is the direct antidote to the taxonomy complaint: install the snippet and it captures every click, page view, form submission and field change retroactively. You define events later, from data you already have, which means the question you did not think to instrument three months ago is still answerable today. Contentsquare completed its acquisition of Heap in December 2023, and Heap continues to be sold with its own product and pricing page inside the Contentsquare portfolio alongside Hotjar.
Key Features
- Retroactive autocapture — no upfront event definition required
- Journeys and funnels built from captured interactions, editable after the fact
- Session replay linked to the analytics events it produced
- Illuminate-style surfacing of friction points the team did not ask about
- Access to the wider Contentsquare experience analytics stack on higher tiers
Use Cases
- Teams with no data engineer to own an event schema
- Retroactive analysis of a launch that was not instrumented in advance
- Ecommerce and B2B SaaS flows where the interesting interactions are dense and hard to predict
Pros
- Eliminates the single biggest operational cost of Amplitude-style analytics
- Free tier up to 10,000 monthly sessions is enough to evaluate properly
- Backed by Contentsquare’s roadmap and enterprise support
Cons
- Session-based pricing is opaque — Growth, Pro and Premier are all custom quotes
- Autocapture generates noise; governance moves from “define events” to “curate events”
- Some buyers are wary of roadmap consolidation now that Heap sits alongside Hotjar and Contentsquare
Pricing — Free up to 10,000 monthly sessions. Growth, Pro and Premier are custom session pricing. See Heap pricing. We cover the platform in more depth in our Heap alternatives guide.
Best For — teams that want product analytics without hiring someone to run the event schema.
5. Pendo — Best For Analytics Plus In-App Guidance
- Class: direct replacement, with an adoption layer attached.
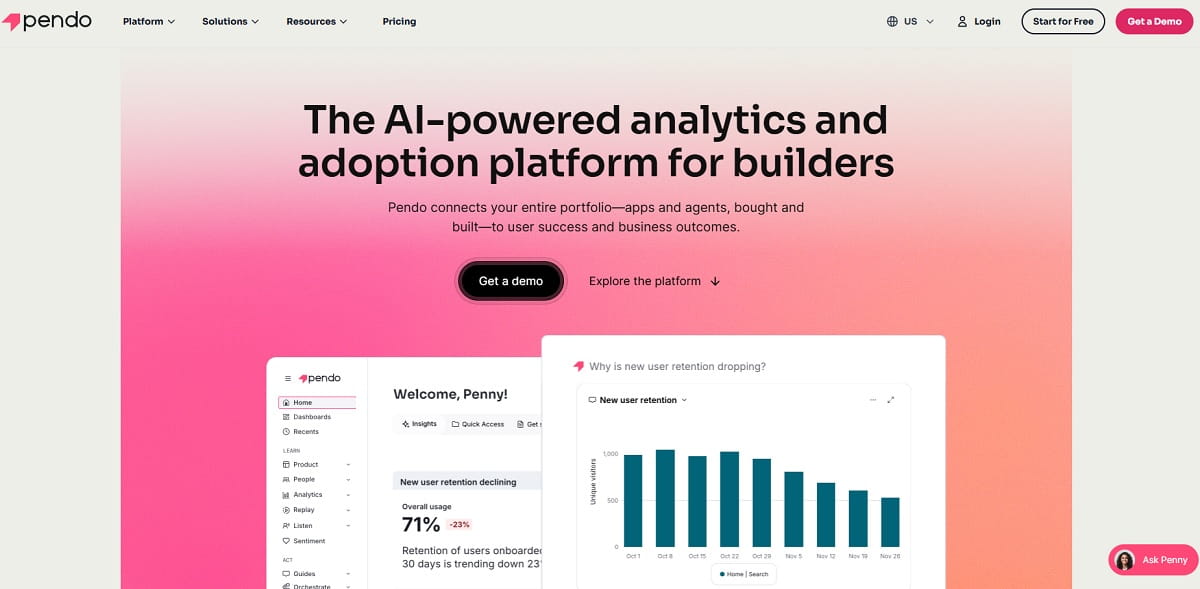
Pendo pairs product analytics with in-app guides, tooltips, walkthroughs and NPS surveys. The value is the loop: you see the feature nobody discovers, then ship a guide to that exact segment without a code release. Amplitude closed part of this gap by acquiring Command AI, but Pendo has been shipping the guidance side for a decade and it shows in the editor.
Key Features
- Product analytics with paths, funnels, retention and feature adoption reports
- Codeless in-app guides, tooltips, onboarding checklists and announcements
- NPS and sentiment surveys targeted by behavior
- Session replay on the Core tier and above
- Public and internal roadmap and idea-collection modules
Use Cases
- B2B SaaS onboarding and feature adoption programs
- Driving migration from a legacy feature to a new one without emailing every customer
- Customer success teams that need behavior data and an intervention channel in one place
Pros
- Free plan up to 500 monthly active users, including analytics and guides
- The analytics-to-intervention loop is genuinely shorter than assembling it from parts
- Strong fit for account-based B2B reporting
Cons
- All paid tiers are custom-quoted on MAU; budgeting requires a sales conversation
- Analytical depth is below Amplitude and Mixpanel for complex cohort work
- Weaker fit for high-volume consumer apps where MAU pricing bites
Pricing — Free up to 500 MAU. Base, Core and Ultimate are custom MAU-based quotes; a free beta tier called Novus is also offered. See Pendo pricing.
Best For — B2B SaaS teams whose next action after an insight is an in-app nudge.
6. Fullstory — Best For Session-Led Digital Experience Analytics
- Class: direct replacement for behavior-first teams.
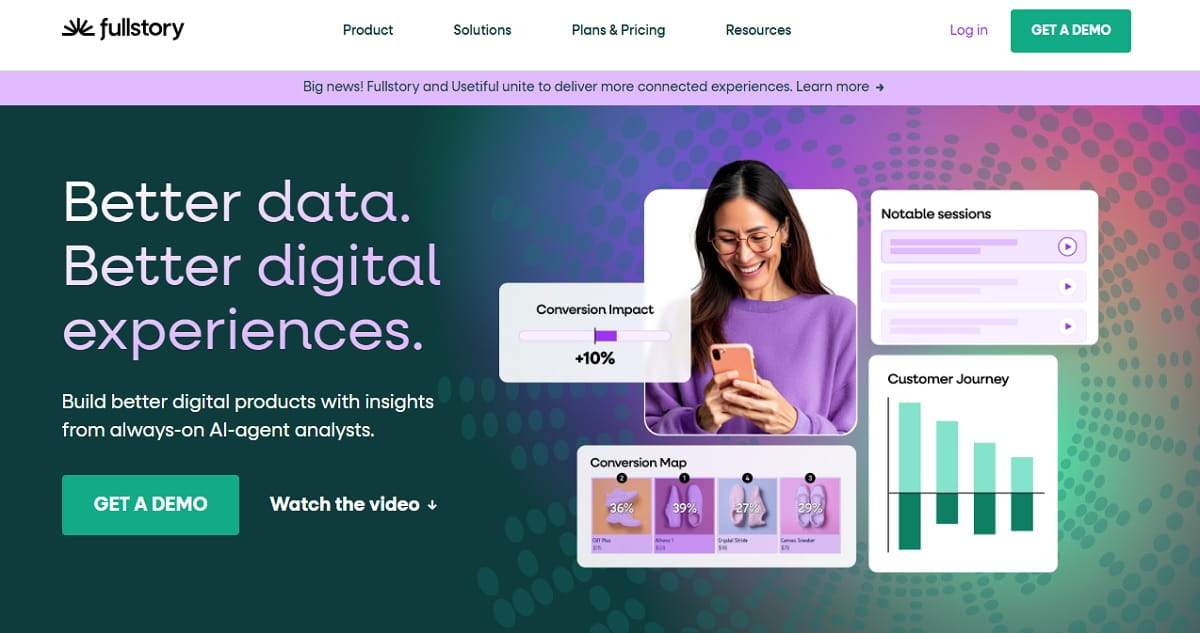
Fullstory inverts the usual order: it captures complete sessions first, then derives metrics from them. That makes it the strongest option when the question is qualitative — why did this cohort rage-click, what did the error actually look like, which DOM element is silently failing on Safari. Its Fullcapture autocapture technology means the retroactive analysis works the same way Heap’s does.
Key Features
- High-fidelity session replay with console, network and error context
- Autocapture-driven funnels, segments, conversions and journey maps
- Frustration signals: rage clicks, dead clicks, error clicks, thrashed cursor
- Warehouse export via the Anywhere product line for teams that model downstream
- Mobile app replay alongside web
Use Cases
- Diagnosing conversion loss that quantitative dashboards flag but cannot explain
- Support and engineering triage — reproducing a bug from the customer’s actual session
- Enterprise UX research at scale, without recruiting participants
Pros
- Free plan at 30,000 sessions per month with 12 months of retention and up to 10 users — one of the most usable free tiers in the category
- Best-in-class replay fidelity and search
- Autocapture removes the taxonomy burden
Cons
- Paid tiers are all quote-based with no published prices
- Retention and cohort analysis is shallower than Amplitude’s for long-horizon product questions
- Session-based pricing punishes high-traffic marketing sites
Pricing — Free plan at 30,000 sessions per month; Business, Advanced and Enterprise require a quote. See Fullstory pricing, and our Fullstory alternatives guide for the wider field.
Best For — teams whose hardest questions are “why,” not “how many.”
7. Google Analytics 4 — Best Free Cross-Channel Analytics
- Class: direct replacement for web-led teams; partial for product-led ones.
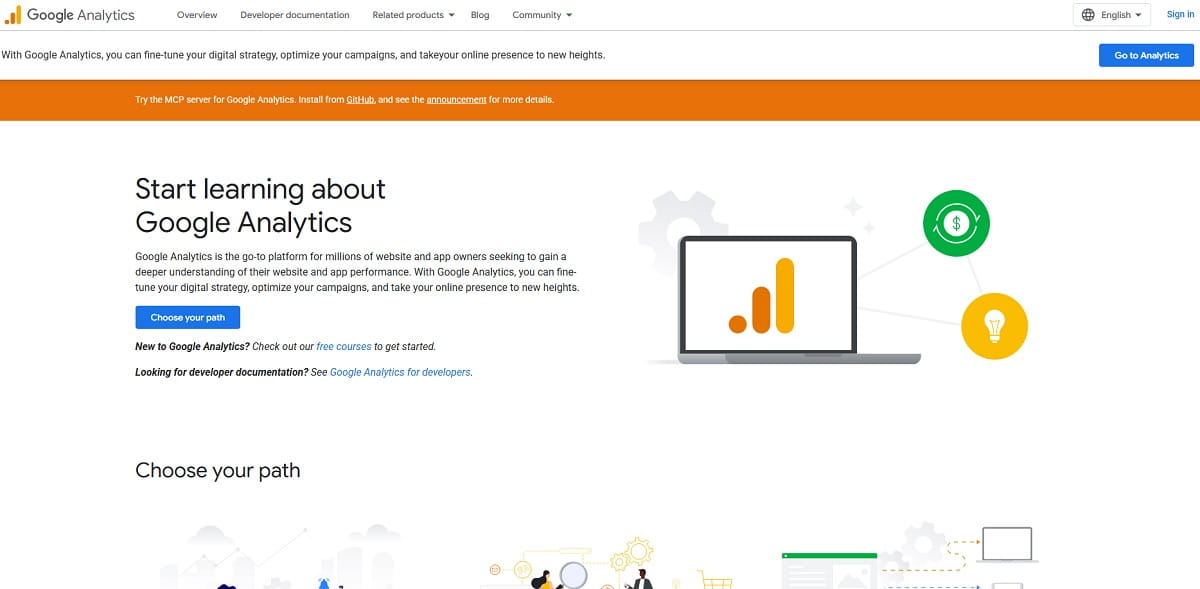
GA4 is an event-based platform, which makes it structurally closer to Amplitude than Universal Analytics ever was. Explorations give you funnels, path analysis, segment overlap and cohort exploration, and the free tier is the full product rather than a crippled trial. For a marketing-led business measuring acquisition through conversion, GA4 plus a behavior tool covers most of what Amplitude was bought for.
Key Features
- Event-based data model with automatically collected and custom events
- Exploration reports: funnel, path, segment overlap, cohort, user lifetime
- Native BigQuery export, including on the free tier
- Cross-platform web and app measurement through Firebase
- Deep integration with Google Ads, Search Console and Looker Studio
Use Cases
- Attribution and channel performance for marketing-led businesses
- Baseline product measurement for teams with no analytics budget
- Feeding raw events into BigQuery for modeling elsewhere
Pros
- Free, and the free version is the real product
- BigQuery export removes the lock-in objection
- Universal skill availability — hiring for GA4 is easy
Cons
- Reports get sampled once a query spans large event volumes, which quietly biases exploration analyses
- Cardinality limits and 14-month default retention hurt long-horizon cohort work
- The interface is widely disliked by product managers coming from Amplitude
- GA 360 contracts typically start around $50,000 per year — there is no gentle middle tier
Pricing — Free. Google Analytics 360 is an annual enterprise contract with no public price list; industry reporting puts entry commitments near $50,000 per year. For the wider field, see our Google Analytics alternatives guide.
Best For — marketing-led organizations that need cross-channel measurement at zero licence cost.
8. Adobe Analytics — Best For Enterprise Multi-Channel Analysis
- Class: direct replacement at the enterprise tier.
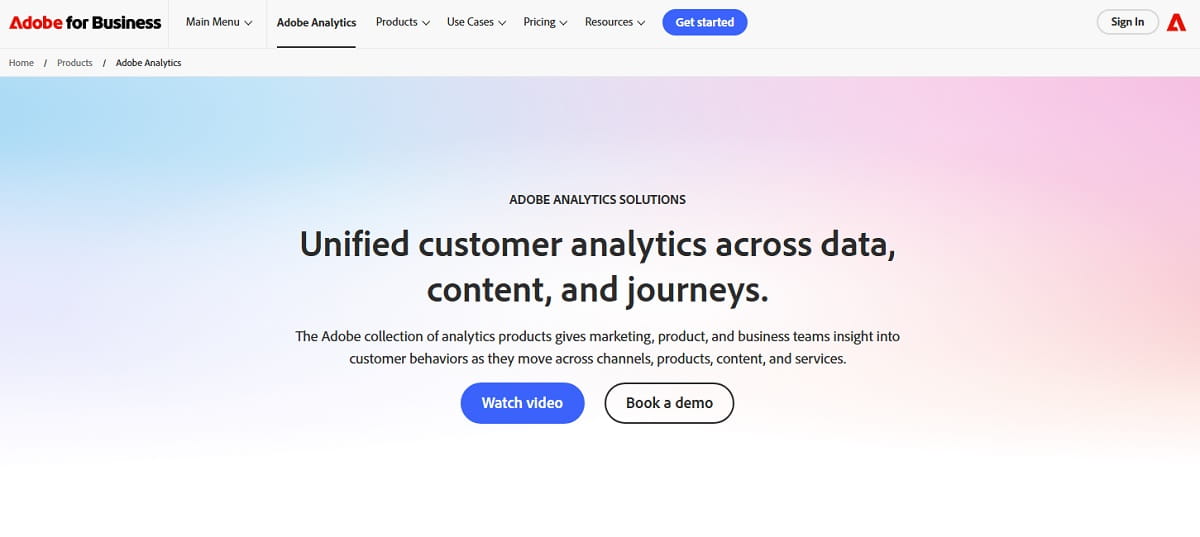
Adobe Analytics is the heavyweight option: segmentation depth, calculated metrics, attribution modeling and Analysis Workspace remain the reference standard for large analytics organizations. Note the portfolio shift — Adobe now positions Adobe Analytics alongside Customer Journey Analytics, which joins behavioral and offline data into identity-resolved profiles. If you are buying today, you are choosing between them, not just replacing Amplitude.
Key Features
- Analysis Workspace with flow, fallout, cohort and attribution panels
- Calculated metrics and segment builder with virtually unlimited depth
- Predictive analytics and anomaly detection driven by Adobe Sensei
- Customer Journey Analytics for cross-channel, identity-stitched journeys
- Tight integration with Adobe Experience Platform, Target and Real-Time CDP
Use Cases
- Enterprises measuring web, app, call centre and offline touchpoints together
- Regulated industries needing granular governance and access control
- Organizations already committed to the Adobe Experience Cloud
Pros
- Analytical ceiling higher than anything else on this list
- Enterprise governance, SLAs and professional services
- Strongest option when marketing and product must share one measurement model
Cons
- No free tier, no public pricing, and a procurement cycle measured in months
- Implementation typically requires a specialist partner
- Overkill for anyone below enterprise scale — this is the opposite of “simpler than Amplitude”
Pricing — Custom quote only.
Best For — enterprises where the analytics team is a department, not a person.
9. Matomo — Best For Privacy-First Analytics And Data Ownership
- Class: specialist alternative — privacy and data residency sub-intent.
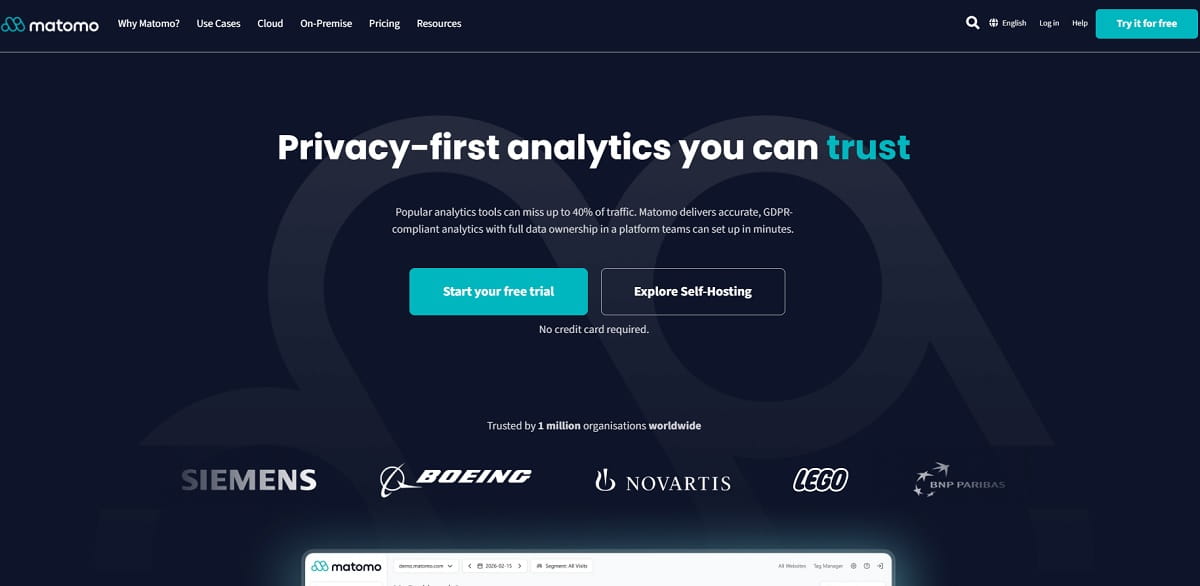
Matomo is the mature open-source answer to “we cannot send behavioral data to a US SaaS vendor.” You own the database, you set retention, and depending on configuration you can run it without cookie consent banners. The product analytics layer — funnels, cohorts, users flow, heatmaps and session recording — exists, but as premium plugins rather than core features.
Key Features
- Full data ownership on self-hosted deployments, or EU-hosted cloud
- 100% unsampled data by default, unlike GA4’s exploration sampling
- Funnels, Cohorts, Users Flow, Form Analytics and Heatmap & Session Recording as premium plugins
- Tag manager, A/B testing and roll-up reporting in the same platform
- GDPR-oriented features: data anonymization, opt-out, right-to-erasure workflows
Use Cases
- EU public sector, healthcare and finance sites with data-residency mandates
- Publishers who need unsampled numbers for ad reporting
- Teams migrating off GA4 for regulatory rather than functional reasons
Pros
- On-Premise Community edition is free forever with unlimited users and hits
- No sampling, no data thresholding
- Cloud entry at €29/month is the cheapest credible paid analytics on this list
Cons
- The product analytics features you actually want are paid plugins, so “free” rarely stays free
- Self-hosting means you own performance tuning, upgrades and backups
- Weaker than Amplitude for product-led metrics like feature adoption over long horizons
Pricing — Matomo Cloud from €29/month for 50,000 hits. On-Premise Community is free forever; the On-Premise Team plugin bundle is €275/month, or €230/month billed annually, for up to 5 million hits. See Matomo pricing and the premium plugin marketplace.
Best For — organizations where data location is a legal requirement, not a preference.
10. CleverTap — Best For Mobile Analytics Plus Engagement
- Class: specialist alternative — mobile and lifecycle marketing sub-intent.
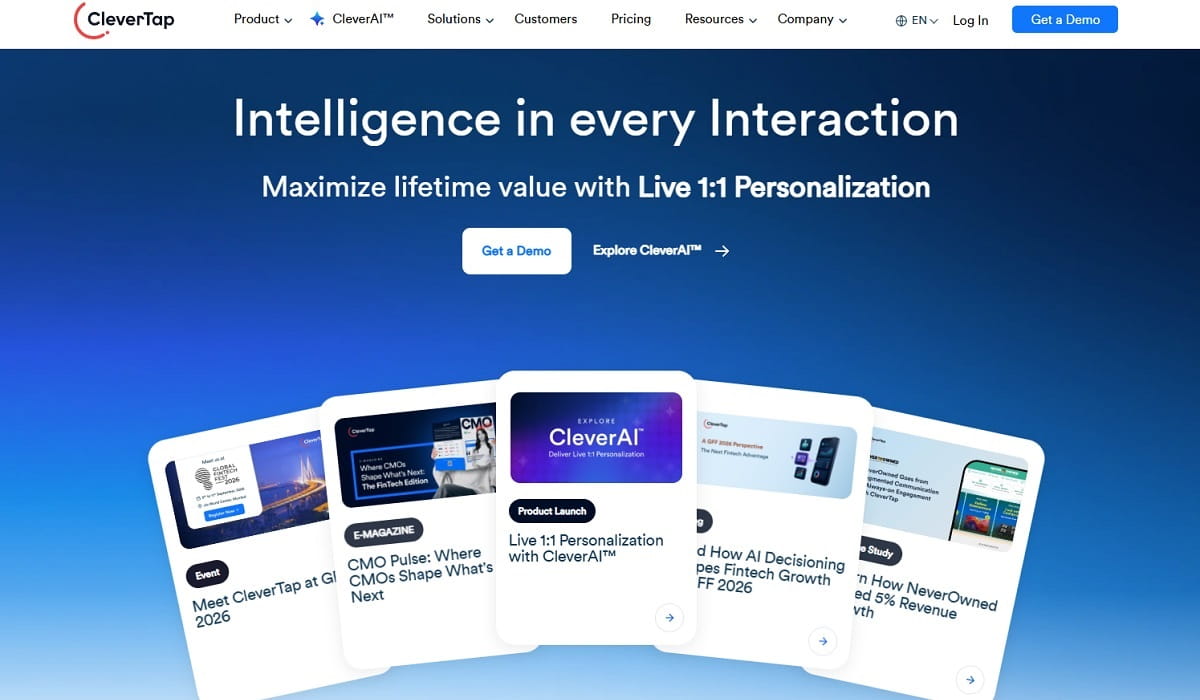
CleverTap combines behavioral analytics with the messaging layer that acts on it: push, in-app, email, SMS and WhatsApp, all segmented by the same event data. If your reason for leaving Amplitude is “we analyse in one tool and message in another and the segments never match,” CleverTap collapses that into one platform.
Key Features
- Event-based analytics with funnels, cohorts, flows and RFM segmentation
- Omnichannel campaign orchestration triggered directly from behavioral segments
- Up to 10 years of customer history retained for long-horizon analysis
- CleverAI decisioning built into every tier
- Strong native SDK coverage for iOS and Android
Use Cases
- Consumer mobile apps in retail, fintech, gaming, media and food delivery
- Retention and churn-prevention programs driven by behavioral triggers
- Teams replacing an analytics tool plus a separate engagement platform
Pros
- Published entry price of $85/month, which is rare among engagement platforms
- Analysis and action in one system, so segment definitions cannot drift apart
- Unusually long data retention
Cons
- Weaker fit for web-only products — the design centre is mobile
- Pro and Ultimate tiers are custom-quoted on MAU
- Analytical depth trails Amplitude for pure product analysis
Pricing — Core $85/month with a 30-day trial, up to 5,000 MAU. Pro is custom to 20,000 MAU; Ultimate is custom for 40,000+ MAU. See CleverTap pricing.
Best For — mobile-first consumer products where the next step after an insight is a push notification.
11. Countly — Best For Self-Hosted Product Analytics
- Class: specialist alternative — self-hosting and data sovereignty sub-intent.
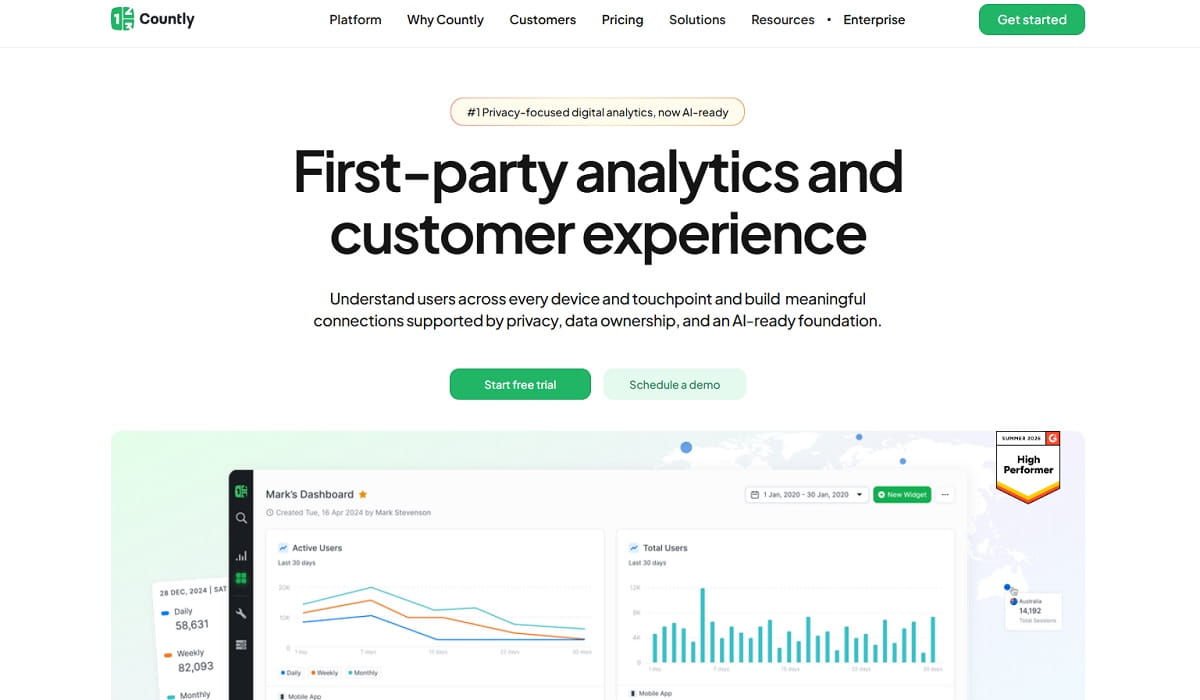
Countly is a privacy-focused product analytics platform for web, mobile and desktop, available as a private cloud service or fully self-hosted on your own infrastructure. It sits between Matomo (web-first, plugin-based) and PostHog (developer-first, source-available): a plugin-extensible product analytics suite you can run entirely inside your own perimeter.
Key Features
- Cross-platform SDKs for web, iOS, Android, desktop and IoT
- Funnels, cohorts, retention, user profiles and crash reporting
- Push notifications and in-app messaging as optional modules
- Plugin architecture for extending the platform without forking it
- Full data-location control on self-hosted deployments
Use Cases
- Government, defence and healthcare products that cannot use multi-tenant SaaS
- Teams that need analytics for a desktop or embedded product, not just web and mobile
- Organizations consolidating crash reporting and product analytics
Pros
- Countly Lite gives a free entry point, and the enterprise edition is genuinely self-hostable
- Usage-based rather than seat-based pricing
- Covers platforms most product analytics vendors ignore
Cons
- Flex starts at $175/month, well above Matomo Cloud or Plerdy
- Smaller ecosystem and community than PostHog or Matomo
- Self-hosting carries the usual operational cost
Pricing — Countly Lite is the free tier. Flex private cloud starts at $175/month with a 14-day trial; Enterprise self-hosted is a custom quote. See Countly pricing.
Best For — teams with a hard requirement to run analytics inside their own infrastructure.
12. Snowplow — Best For Warehouse-Native Behavioral Data
- Class: specialist alternative — this replaces Amplitude’s collection layer, not its interface.
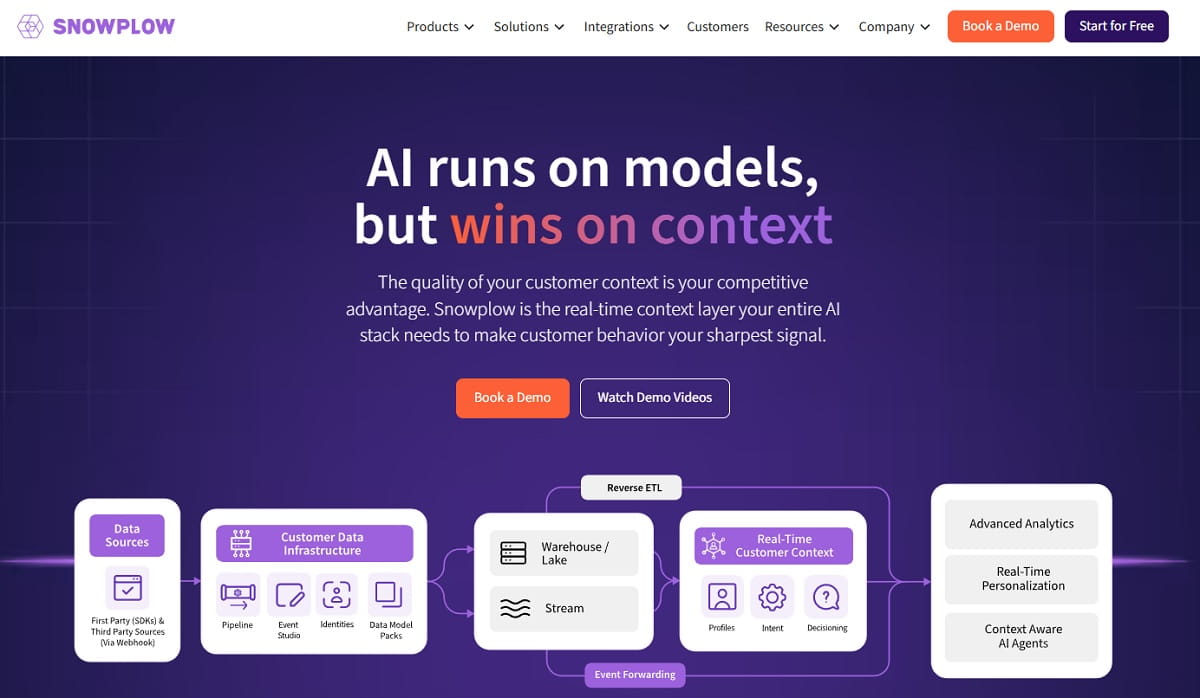
Be clear about what Snowplow is before you shortlist it: a behavioral data pipeline, not an analytics dashboard. It collects rich, schema-validated event data and lands it in your own warehouse — BigQuery, Snowflake, Databricks, Redshift — where your team models and visualizes it. Teams choose it when Amplitude’s real problem was data ownership and modeling flexibility, and when they already have a BI layer and analytics engineers to point at the output.
Key Features
- Schema-first event collection with validation and enrichment at the pipeline level
- Data lands in your own cloud warehouse — full ownership, no vendor copy
- Real-time streaming plus batch loading
- Self-hosted pipeline option, or a fully managed Snowplow Platform with a console UI
- dbt models for common behavioral analyses
Use Cases
- Data teams building a first-party behavioral data foundation for AI and ML
- Organizations that need every event, unsampled, in their own warehouse
- Replacing a bundled SaaS analytics contract with pipeline plus BI
Pros
- Maximum control over schema, enrichment and retention
- No per-event vendor markup on data you already store
- Removes vendor lock-in at the collection layer entirely
Cons
- You must supply the analysis layer — this is not a product manager’s tool
- Requires analytics engineering capacity to be worth the cost
- The open-source path now sits under the Snowplow Limited Use License, which carries a non-commercial restriction unless you take the self-hosted commercial option
Pricing — 14-day free trial; self-hosted pipeline and the managed Snowplow Platform are both quote-based. See Snowplow pricing.
Best For — data-engineering-led organizations whose objection to Amplitude is architectural.
Amplitude Vs The Alternatives: Feature Comparison
| Tool | Autocapture | Session Replay | Funnels & Retention | Experiments / Flags | Self-Host |
|---|---|---|---|---|---|
| Amplitude | Partial | Yes | Yes, deep | Yes (incl. Statsig) | No |
| Plerdy | Heatmap-level | Yes | Funnels yes, retention light | A/B testing | No |
| Mixpanel | No | Yes | Yes, deep | No | No |
| PostHog | Yes | Yes | Yes | Yes, native | Yes |
| Heap | Yes, retroactive | Yes | Yes | No | No |
| Pendo | Yes | Core tier and above | Yes | Guide-level targeting | No |
| Fullstory | Yes | Yes, best in class | Yes | No | No |
| Google Analytics 4 | Enhanced measurement | No | Yes, sampled at volume | No | No |
| Adobe Analytics | Partial | Via Adobe stack | Yes, deep | Via Adobe Target | No |
| Matomo | No | Premium plugin | Premium plugins | A/B testing plugin | Yes |
| CleverTap | No | No | Yes | Campaign testing | No |
| Countly | Partial | No | Yes | A/B testing module | Yes |
| Snowplow | Configurable | No | Via your warehouse | No | Yes |
No single row matches Amplitude across every column, which is the honest answer to “what is the best Amplitude alternative.” The realistic pattern for most teams is two tools: one that measures product behavior, and one that shows what that behavior looked like on the page.
Tools That Are No Longer Amplitude Alternatives
These names still appear on competing lists. Including them in 2026 would send you toward a dead end.
- Statsig — after OpenAI’s acquisition in September 2025, Amplitude took on the Statsig brand and customers in May 2026. Statsig’s own homepage now describes it as part of the Amplitude family. Selecting it does not move you off Amplitude.
- June.so — the standalone product wound down on 8 August 2025 when the founding team joined Amplitude. New signups are not available.
- Indicative — acquired by mParticle in 2022 and folded in as mParticle Analytics; mParticle itself was acquired by Rokt in January 2025. The standalone Indicative product no longer exists.
- Google Optimize — sunset in September 2023. Lists that still recommend it as the free experimentation companion to GA4 have not been updated in three years. Our Google Optimize alternatives guide covers what replaced it.
Two related consolidations worth knowing about, even though both products are still sold: Heap is now part of Contentsquare, alongside Hotjar. That is not a reason to exclude them — it is a reason to ask about roadmap commitments during procurement.
How To Choose The Right Amplitude Alternative
Work from the reason you are leaving, not from a feature matrix. Each of these paths ends somewhere different.
If The Problem Is Cost
Start with the free tiers that are genuinely usable at your volume: Mixpanel (1M events), PostHog (1M events), Fullstory (30k sessions), GA4 (free product), Plerdy (free forever). Model your actual monthly event volume first — most cost surprises come from autocaptured events nobody audited. If your traffic is web and your metric is conversion, a $32/month behavior tool plus free GA4 replaces a four-figure contract more often than teams expect.
If The Problem Is Complexity
Autocapture removes the largest source of setup friction: Heap, Fullstory and PostHog all capture first and let you define events later. If the complexity is in the reporting rather than the instrumentation, Mixpanel is the shortest ramp for product managers.
If The Problem Is That You Are A Website, Not An App
Product analytics platforms are built around a logged-in user doing repeated sessions. Marketing sites, content sites and most ecommerce stores are not that shape. Heatmaps, session replay, form analytics and funnel drop-off give you more actionable signal per hour spent. This is the case where Plerdy replaces Amplitude outright rather than supplementing it — see our funnel analysis walkthrough for what the workflow looks like.
If The Problem Is Privacy Or Data Residency
Matomo (self-hosted or EU cloud), Countly (self-hosted) and PostHog (self-hosted) are the three credible options. Snowplow is the right answer when the requirement is that raw events must land in your own warehouse rather than any vendor’s.
If The Problem Is Mobile Engagement
CleverTap merges analytics with push, in-app and messaging. Countly is the self-hosted equivalent. Neither will match Amplitude’s analytical depth — that is the trade you are making for an integrated action layer.
How To Migrate Off Amplitude Without Losing Your History
Analytics migrations fail in predictable ways. This sequence avoids most of them.
- Export your raw events before you cancel. Amplitude’s Export API and warehouse connectors let you pull historical event data out. Do this while the contract is live — access ends when the contract does.
- Audit which reports are actually used. Pull the list of dashboards opened in the last 90 days. Most teams find fewer than a dozen reports drive every decision, which shrinks the migration enormously.
- Run both tools in parallel for at least one full billing cycle. You need overlapping data to explain why the new tool’s number differs from the old one — and it will differ, because session definitions, bot filtering and deduplication rules are never identical.
- Rebuild the core reports first, not everything. Activation funnel, retention curve, top conversion path. If those match within a tolerance you have agreed in advance, the migration is working.
- Rewrite the event taxonomy while you have the chance. A migration is the only politically viable moment to delete 200 dead events. Do not port the swamp into the new platform.
- Keep a read-only archive. Land the exported history in BigQuery, Snowflake or S3 so year-over-year comparisons remain possible after the tool is gone.
Budget realistically. A migration touching a mature instrumentation layer is a multi-sprint project, not a snippet swap — the tag takes an afternoon, the trust takes a quarter.
Common Mistakes When Switching Analytics Platforms
- Choosing on feature count instead of the question you need answered. The tool with the longest feature list is rarely the one your team opens on a Tuesday morning.
- Ignoring who will actually use it. A platform that only the data team can operate produces the same outcome you are leaving Amplitude for.
- Forecasting cost from today’s event volume. Autocapture and growth both multiply events. Model 12 months out, at the tier boundaries, before signing.
- Skipping the parallel-run period. Without overlap you cannot distinguish “the new tool is wrong” from “the old tool was wrong.”
- Replacing a quantitative tool with another quantitative tool when the gap was qualitative. If your dashboards already tell you where users drop off and you still cannot fix it, you need session replay and heatmaps, not a different funnel chart.
- Trusting a listicle without checking vendor status. Three products commonly recommended as Amplitude alternatives in 2024 are, in 2026, either shut down or owned by Amplitude.
Frequently Asked Questions
What Is The Best Alternative To Amplitude?
There is no single best answer, because the reason for leaving determines the destination. Mixpanel is the closest like-for-like product analytics replacement. PostHog is the best choice for engineering-led teams that want analytics, session replay and feature flags in one stack. Plerdy is the strongest fit for website and ecommerce teams whose real question is where visitors drop off on a page, not how a cohort retains over 12 weeks. Matomo and Countly are the answers when data residency is a legal requirement.
Are There Free Amplitude Alternatives?
Yes, and several free tiers are genuinely usable rather than demos. Google Analytics 4 is free as a full product. Mixpanel and PostHog each include 1 million events per month at no cost. Fullstory’s free plan covers 30,000 sessions per month with 12 months of retention. Plerdy has a free forever plan covering heatmaps, session recordings, SEO auditing and unlimited A/B testing. Matomo On-Premise Community edition is free forever if you can host it yourself.
Is Statsig Still An Amplitude Alternative?
No. OpenAI acquired Statsig in September 2025 for a reported $1.1 billion, and in May 2026 Amplitude took on the Statsig brand, customer base and platform maintenance, while the original team stayed at OpenAI. The Statsig site now describes the product as part of the Amplitude family. Choosing Statsig today means choosing Amplitude, so it does not belong on a list of alternatives.
Is Mixpanel Better Than Amplitude?
They cover the same analytical ground. Mixpanel is generally rated easier for non-analysts to learn and has a more generous free tier at 1 million events per month. Amplitude carries more depth in behavioral cohorting and now bundles experimentation, guides, surveys and Voice of Customer into one platform after the Command AI, Kraftful and Statsig moves. If breadth in a single vendor matters, Amplitude wins; if speed to a usable report matters, Mixpanel usually does.
What Are The Best Open Source Amplitude Alternatives?
PostHog is the most complete option, with product analytics, session replay, feature flags and experiments available self-hosted. Matomo is the mature choice for web analytics with full data ownership and a free On-Premise Community edition. Countly covers web, mobile and desktop with a self-hosted enterprise edition. Snowplow provides the collection pipeline rather than an interface, and its open path now sits under the Snowplow Limited Use License, which restricts non-commercial use unless you take the commercial self-hosted option.
How Much Does Amplitude Cost In 2026?
Amplitude now prices on events rather than monthly tracked users. The Free plan includes 2 million events per month. Plus starts at $0 with the first 2 million events free and scales to roughly 70 million events. Growth and Enterprise are custom, event-based quotes. Every tier includes product analytics, session replay, feature and web experimentation, guides and surveys. Older articles quoting MTU tiers are describing a pricing model Amplitude has replaced.
Can A Heatmap Tool Replace Amplitude?
For a website or online store, often yes. Product analytics platforms are designed for logged-in users returning to an app over weeks. Marketing sites, content sites and most ecommerce stores generate their value in single sessions, where heatmaps, session replay, form analytics and a short conversion funnel answer more questions per hour than cohort analysis. For a subscription product whose core metric is week-8 retention, a heatmap tool is a complement, not a replacement.
How Long Does It Take To Migrate Off Amplitude?
Installing a new tag takes an afternoon. Rebuilding trust in the numbers takes a quarter. Plan for a parallel run of at least one full billing cycle so you can explain discrepancies between the two platforms, rebuild only the reports actually used in the last 90 days, and export your raw Amplitude event history before the contract ends — access disappears with the subscription.
Choosing With Evidence Rather Than A Feature List
The honest summary of this category in 2026: the Amplitude alternatives market is consolidating, and two of the names on older lists are now inside Amplitude itself. What remains splits cleanly. Mixpanel, PostHog, Heap, Pendo and Fullstory compete for the product analytics job. GA4 and Adobe compete for the cross-channel measurement job. Matomo, Countly and Snowplow compete on ownership and residency. CleverTap competes on turning analysis into a message.
And a large share of the teams running this search do not need any of those — they need to see the page, the click, the hesitation and the drop-off, then fix it this week. If that is you, start with Plerdy’s free plan: heatmaps, session replay, event tracking, funnel analysis and A/B testing on one script, with no contract to negotiate. Add a product analytics platform later, when your questions genuinely outgrow the page.
Related reading: best product analytics software tools, Mixpanel alternatives, best UX analytics tools, and Contentsquare alternatives.