
For the performance of your website, Google Analytics functions as your crystal ball. It provides all the information required on the behavior of your guests on the website. Tracking your conversion rate (CR, Goal, and Events) on Google Analytics is among the most crucial tasks there is. That is your website’s dashboard of performance. It indicates the proportion of visitors to your website who are really acting in the intended manner—that of making a purchase (eCommerce tracking) or newsletter subscription registration.
Still, it’s crucial to review it routinely, just like with any analytics report. Otherwise, you would be in dark regarding the performance of your website. This post will walk you through some tips and illustrate you to view your Google Analytics conversion rate. So take your magic wand—or mouse—then let’s explore the realm of Google Analytics conversion rate.
What is Conversion in Analytics?
An important component of analytics that enables digital marketers and website owners to evaluate and grasp their performance is the conversion rate.
In digital marketing, the conversion rate is a crucial statistic since it let one assess the effectiveness of campaigns. Understanding the proportion of their traffic that is turning into consumers helps companies to modify their plans. They also help to maximize their costs and pinpoint which initiatives show more success. If a company runs several campaigns and one higher conversion, for instance, they might commit more funds to that campaign and expand its influence.
All things considered, the conversion rate is a crucial element of analytics that will let digital marketers and website owners improve their initiatives. Understanding the conversion rate helps companies decide how best to distribute their resources and raise the success of their efforts on digital marketing.
Default Conversion Rate Factor Calculation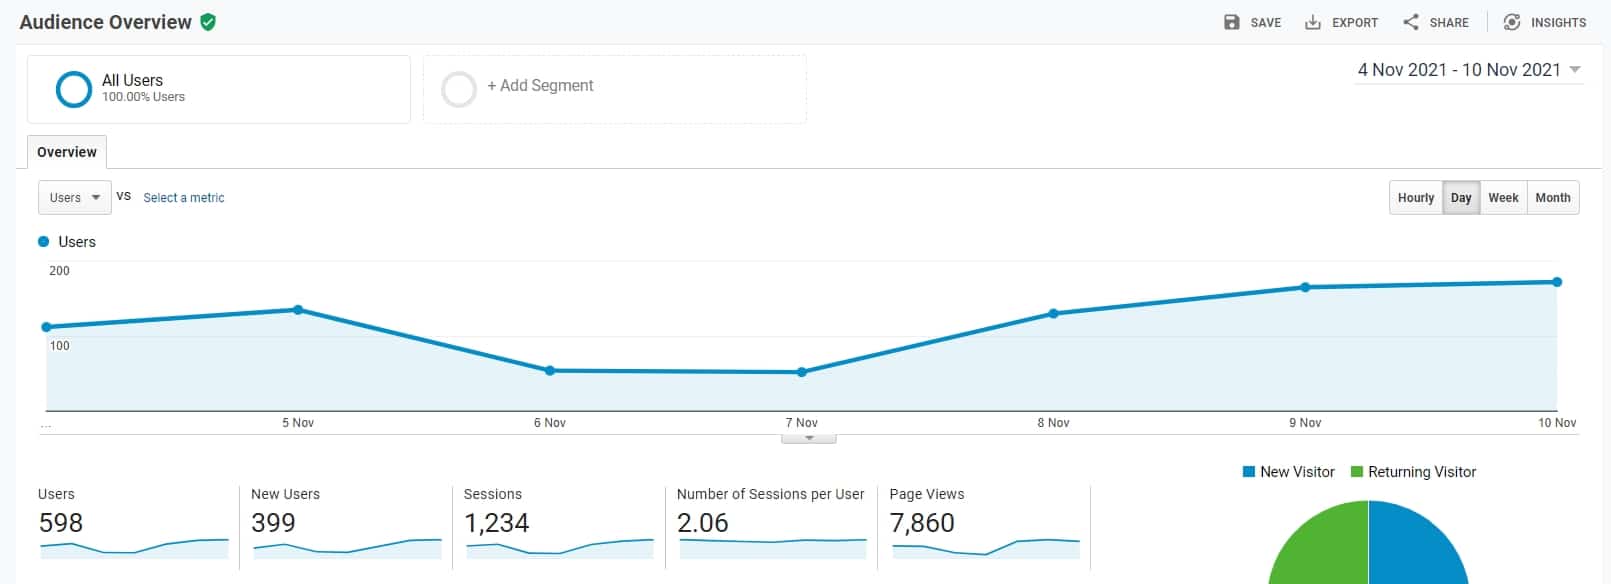
Google Analytics finds the conversion rate by default as the number of conversions divided by the number of sessions (or visitors) multiplied by 100.
The conversion rate, for instance, would be 30/1000 = 0.05 x 100 = 3% if a website attracted 1000 visits and thirty made a buy.
E-commerce websites frequently utilize this computation to gauge the proportion of users who buy. Google Analytics and Plerdy, however, let you create tailored conversion tracking and varying conversion rates depending on the objectives of your website.
Note that once during a website visit the goal is found. For instance, this behavior will still be recognized as one goal even if a client visits the landing page numerous times during the session. Still, the user should take front stage instead of the session itself. Besides, the session tracking pauses at half an hour of inaction. Google Analytics will view a user returning in four days as a new session.
What is the difference between micro and macro conversion?
Two crucial gauges of digital marketing performance are micro and macro conversions. Micro conversions are little activities users of a website perform. Macro conversions, on the other hand, are more like purchasing—larger objectives.
Micro conversions are exemplified by:
- Registering for a newsletter.
- Downloading an ebook
- Engaging with the information
- Following a podcast in subscription form
- Watching a film
- Add to the cart;
- Search
Macro conversions consist in part as follows:
- Buying anything
- Finishing a register application
- Presenting a lead form.
- Getting a quotation
For general monitoring of website performance, micro and macro conversions are rather significant indicators. Understanding and monitoring micro and macro conversions helps website owners to make better decisions and maximize their efforts.
Methods to Increase Conversion Rate from Google Analytics
You should apply Google Analytics’s tips to implement more effective web design and marketing strategies. As a result of such data-driven solutions, conversion rates will increase.
Here are some tips and tricks to follow:
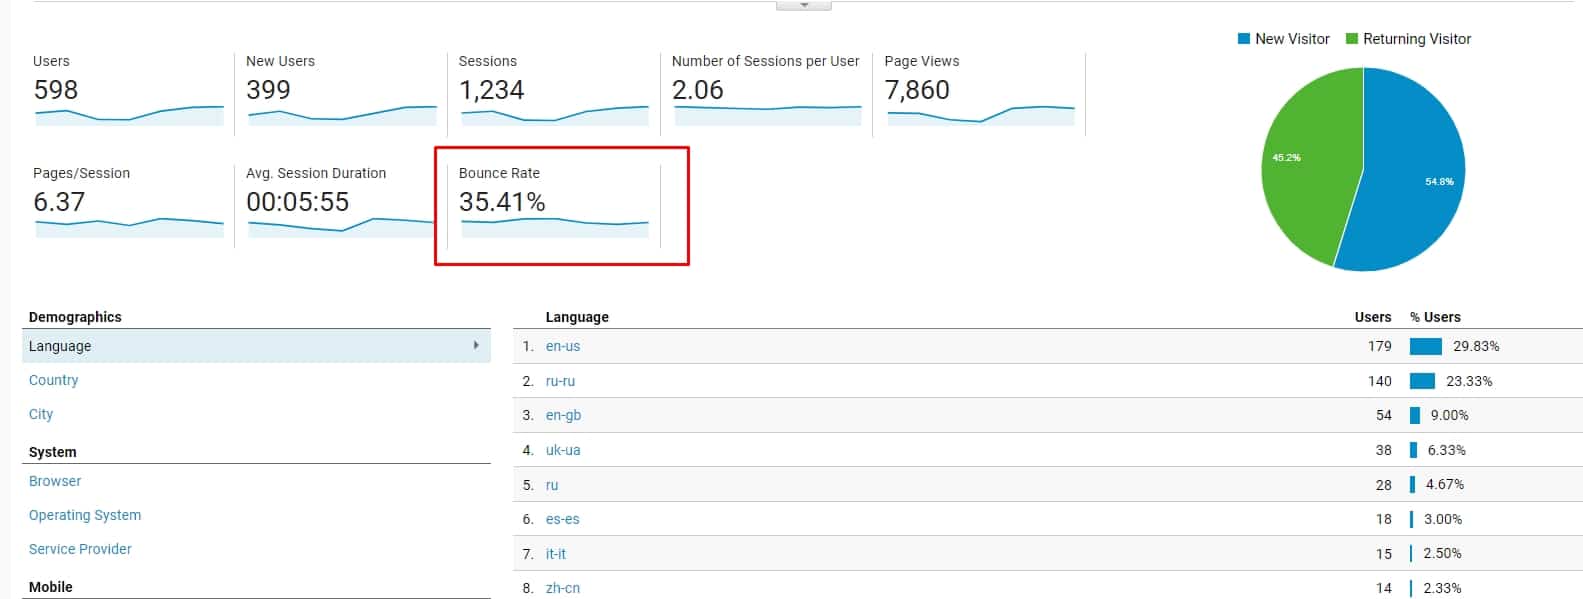
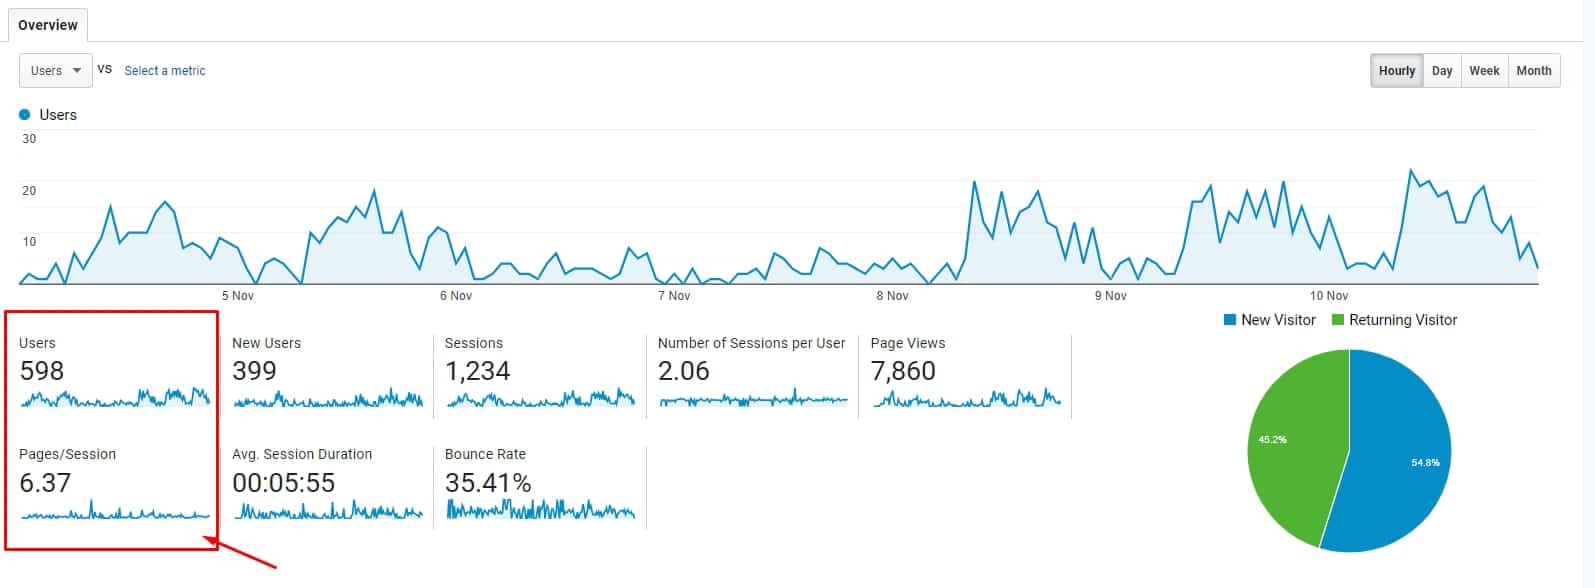
Bounce Rate Tracking
The rejection rate is the ratio of those who leave your website after staying just on one web page. Track these scores with GA 3 by clicking Behavior > Site Content > Target Pages.
GA4 Engagement Rate
GA4’s Engagement rate provides valuable insights into user behavior on your website. But collecting data once in a while is not enough. To effectively analyze the engagement rate in GA4, you should measure it over time, compare it to industry benchmarks, and monitor key metrics such as bounce rate, session duration, and pages per session.
Using Internal Site Search
Checking the internal search report on the site will help you find out what elements users are looking for and what difficulties they have in searching. To view these indicators, click «Behavior» > «Site Search» > «Overview.»
Detecting Slow Page Loading
In our rapidly changing world, nobody wants to wait long for downloading. Thus, the significant aspect of UX improvement is the optimization of the site download speed. GA allows defining a slow boot time by clicking Behavior > Site Speed > Page Load Time.
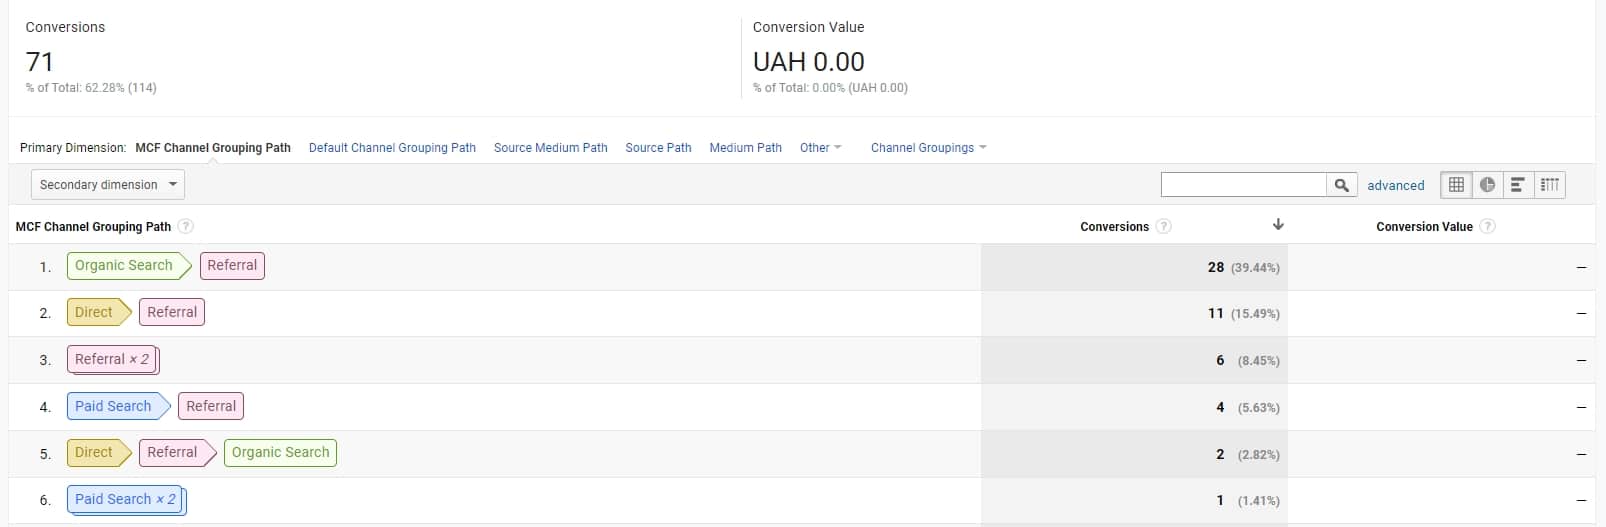
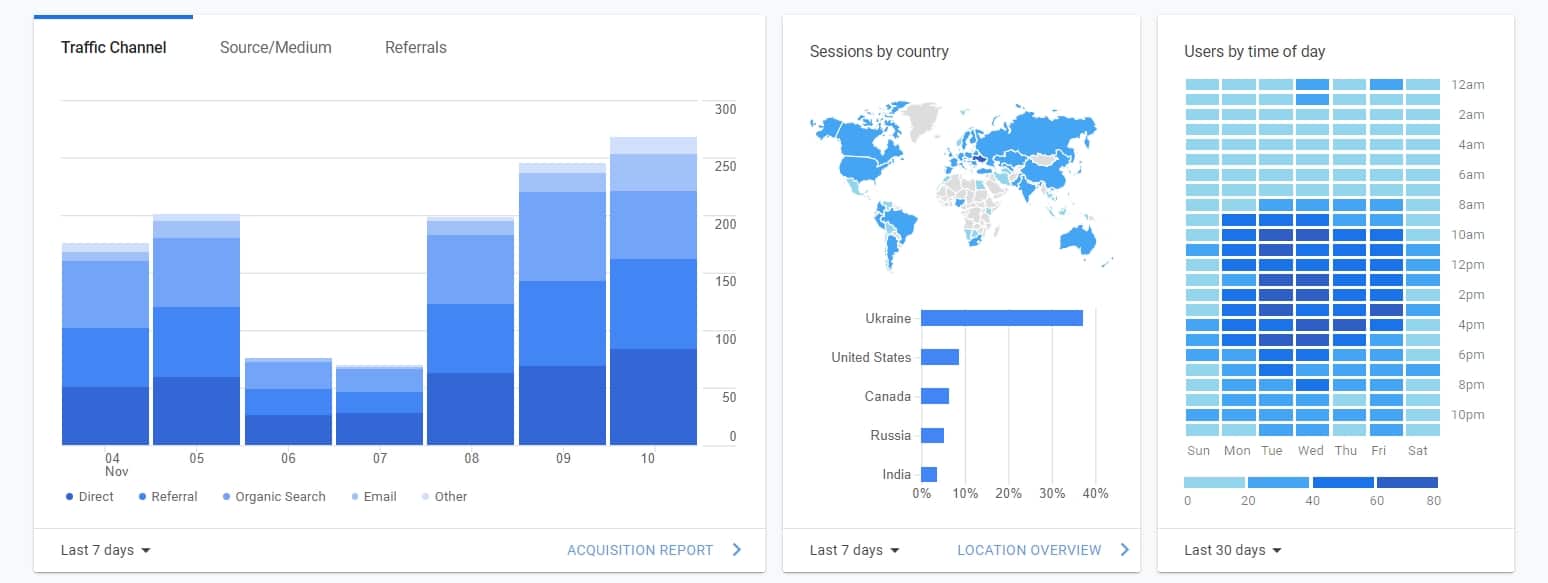
Calculation of Organic Traffic
Move to Acquisition > All Traffic > Channels to inspect the effectiveness of your digital marketing strategy by checking traffic and contrasting the results by date.
Session and user conversion factor
Google Analytics can provide conversion ratings based on both users and sessions. The primary difference between a session conversion and user conversion is the data used to identify website visitors. It is either sessions or users. A session is a period of user activity on your website or in an application. Consequently, the conversion rate may ultimately be inaccurate, as many users have numerous sessions.
Analysts have different opinions as to the best method to calculate the conversion factor. Some experts note that the session provides a unique possibility to convert. In contrast, user performance often includes multiple sessions.
Tthe proponents of the user-based conversion factor state that conversion usually requires more than one session. For example, it works for expensive purchases, such as an engagement ring. In such a way, viewing user conversions in Google Analytics will be more informative. It is, therefore, worth considering the conversion rate of users.
Conversion rate at the user level
The conversion rate at the user level is based on Google’s 6-month cookie file, which allows tracking individual users. For example, if you have 10,000 sessions and 100 transactions per month on your site, the conversion rate will be 1% according to the session conversion rate. However, if the user conversion rate is applied, it is 1.25%. The conversion rate at the user level gives you a clearer picture of the website performance for further analysis. This is usually 20-25% higher than the conversion at the session level.
However, this method has shortcomings. For example, tracking one customer on different devices can cause some problems. In addition, clients who browse incognito or delete their cookies are frequently considered more than one visitor. It can be a meaningful reason to mind both user and session conversions. Google Analytics can combine user conversion rates and sessions in a single report, convenient for detailed data analysis.
How to configure the conversion rate in Google Analytics
You must configure goals to l conversions on your website Follow the next instructions to perform this task:
- Step 1. «Administrator» on the left panel and tap «Targets» in the option «View».
- Step 2. Press «+ New Goal» to create a new target.
- Step 3. Add a description and information about your target.
- Step 4. Select the target option «Event».
- Step 5. Indicate the aspects of the goal. Now you can apply the templates for «Category» and «Conversion» for «Actions».
If you have to configure e-commerce tracking for Google Analytics, use these steps:
- Create a GA account and enter the URL of your website after configuring it.
- Get your tracking ID.
- Install the Google Analytics tracking code on all pages you are going to track.
- Include «E-Commerce Settings» and «Advanced E-Commerce Reports» by selecting «Administrator» > «View Settings» > «E-Commerce Settings».
Plerdy’s tool “Sales Efficiency” offers a set of features similar to the “Sales Efficiency” features from Google Analytics. At the same time, it can help you enhance some unique website metrics. According to Plerdy’s testing, Plerdy’s new Sales Performance product showed more accurate results than Google Analytics.
Google Analytics 3 vs. Google Analytics 4 Conversion Rate
Google Analytics 3 (GA3) and Google Analytics 4 (GA4) are both powerful tools for tracking website user behavior. However, there are significant differences in how they measure and track conversion rates.
In GA3, the conversion rate is the number of conversions divided by the number of sessions. GA4 uses the number of conversions divided by the number of users. This means GA4 provides more accurate data, especially for websites with a high number of returning visitors.
GA4 also offers advanced features such as machine learning and cross-device tracking, giving deeper insights into user behavior and more detailed optimization recommendations.
Experts like Avinash Kaushik and Brian Clifton have praised GA4 for its advanced features and deeper insights. However, GA3 is still widely used and provides valuable information. So the choice between the two should be based on specific business needs. It’s recommended to monitor conversion rate over time and compare it to industry benchmarks to identify trends and areas for improvement.
How to Improve Conversion Rate Using Heatmap and Video Session Recording?
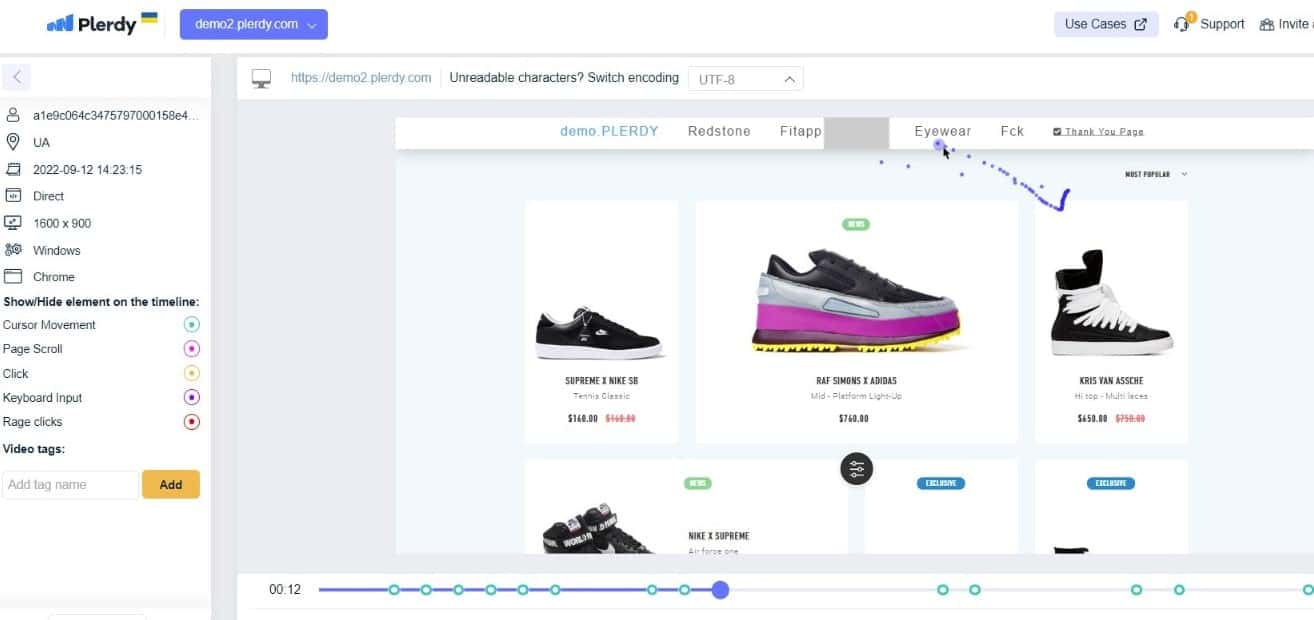
Increasing conversions is crucial for any website and digital marketing campaign. One of the most effective ways to increase conversions is to use Plerdy heatmaps and record video sessions.
Plerdy heatmap analysis is a powerful tool to understand user behavior. By tracking how users interact with elements on a web page, website owners can identify areas that need improvement to increase conversions. Additionally, video session recordings can be used for further usability analysis, allowing website owners to gain valuable insights into website errors.
Using Plerdy heatmap analytics and video session recordings, website owners or UX professionals can make data-driven decisions to improve their websites and increase conversions. Heatmaps help identify where users click and where they lose interest, while video recordings can provide a deeper understanding of user behavior.
Conclusion Google Analytics Conversion Rate
If you use Google Analytics, you may have noticed that some website visitors do not convert into leads. While there are many reasons for this, one of the most common causes is that customers interested in an offer cannot complete the purchase or leave a request.
To give your business the best chance of converting a lead into a paying customer, you must detect the exact reason behind bouncing leads… You can do it by trying Plerdy for free.
While Google Analytics shows conversions, it doesn’t show why people don’t convert to buyers. This means you get more opportunities to improve your conversion rate through better targeting with data from heatmaps and video sessions.