
Every website owner wants their site to rank the highest on all search engines and be the most appealing option to millions of consumers. An excellent method for the latter is employing the help of website heatmap tools to optimize a web page and increase conversions. Keep reading to know how to make your website rock and sales boom.
Website heatmap tools have become a popular mainstay in understanding user behavior and helping owners discover where their site fails regarding usability and functionality.
The best heatmap tool even points to the exact areas of the website where users interact the most. Thus, a heatmap becomes an essential technique in every website admin’s analytics toolkit, in addition to Google Analytics.
This article will delve deeper into the 11 benefits of using heatmap tools and explain why their implementation is increasing. By the end of this post, you will understand why startups and corporate businesses should consider heatmap software an integral piece of kit and the best tool for the job.
What Is a Website Heatmap Tool?
Website heatmap tools are methods or specific software clarifying how to improve customer interaction with each web page of your website. These tools present a color-coded graphical report which signifies your landing pages’ hot and cold spots.
Heatmap apps are great at generating a visual report representing website visitors’ activity. For example, you can see where your visitors click and which pages they visit more frequently than others using heatmap software.
You can also use heatmaps to identify the web pages and the elements on those pages that get no clicks. At present, these are the most efficient tools for deriving this data.
Heatmaps also track mouse movements to showcase where visitors often click or have their cursor placed when browsing your website. Finally, consider heatmaps similar to GPS devices that tag all website visitors and monitor and record their movements.
The colors make the reports very easy to read since they visualize the so-called temperature values of each website page. Red and orange mark the areas users frequently interact with, whereas green and blue highlight areas or elements with the least user interaction potential.
How to Do Website Heatmap Tools Work?
The heatmap for website software analyzes web pages and divides them into interactive elements. Then these are grouped by their tags and larger elements that contain them. Once the mapping is complete, the website heat map software tracks and records visitors’ activity.
Heatmapping tools isn’t a new phenomenon by any means. It has been part of website optimization accreditation, CRO courses, and online marketing certification programs for a long time. Heatmap tools are used in data processing and representation and are great at visualizing complex data because they are easy to read and understand, unlike charts and tables.
Some of the best heatmap tools like Plerdy, Crazy Egg, Hotjar, and Lucky Orange are already being used in all leading eCommerce platforms to increase sales turnovers and bring maximum revenue. Map creation is the primary step in building a visual representation of analytic data.
Every activity gets flagged and stored in the database. The heatmap software tracks the movement of unique visitors only, collecting only the most accurate data presented. It records real-time activities and builds reports likewise.
Every report displays the most recent data, making heatmaps a vital tool for tracking website changes and maintenance effectiveness. It can even spot the elements that put your website on the list of bad designs.
A List of 11 Best Website Heatmap Tools
Many top-notch tools will help you build highly-informative heatmaps to track and analyze user interaction. Here is the best software to use.
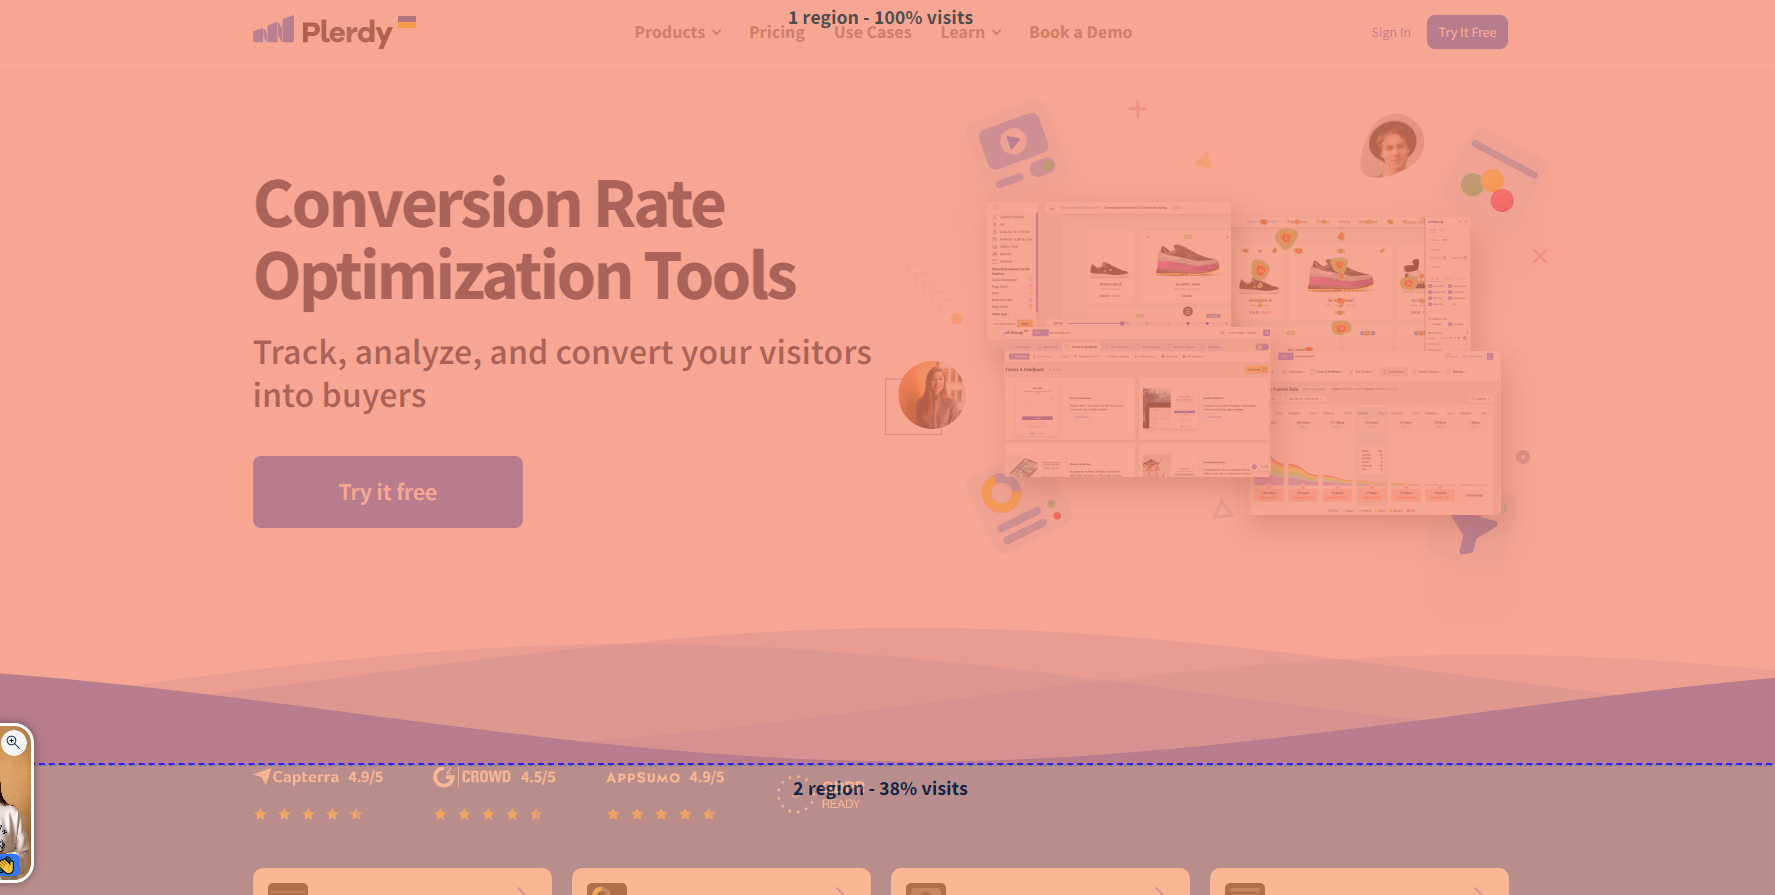
Plerdy
Plerdy is a flexible digital marketing solution meant to improve website UI/UX by means of several technologies. Without the need for images, its heatmaps give a comprehensive picture of user activity by real-time tracking of user behaviors including clicks, cursor movement, and scroll depth. Dynamic components include pop-ups, drop-down menus, and other on-page tools let you track user engagement. Plerdy’s special segmentation tool lets you easily spot the most important interactions by filtering data depending on traffic source, device type, or user journey stage.
Salient characteristics:
- Real-time heat map tracking on live page view
- Scroll depth and mouse hovering tracking
- Dynamic elements support (such as drop-downs and pop-ups).
- Traffic source-based data segmentation including device
Price:
- Beginning at $29 a month, offers a 14-day free trial including all services.
Smartlook
Offering a whole picture of user behavior, Smartlook is renowned for its strong mix of heatmap website and session records. Tracking clicks, movement, and scroll patterns, this program compiles this information into simple heatmaps. Examining user sessions closely will help you to better grasp how guests move across your website. Smartlook is particularly helpful for companies aiming at improving their user flows and fixing conversion funnel weaknesses. It connects with main analytics systems so you may sync heatmap data with other tools for more in-depth understanding.
Smartlook customers are Sewio, AstroPay, Vertigo Games and Hookle.
Salient characteristics:
- Session recordings with finely tuned playbacks
- Many kinds of heatmaps (click, scroll, movement)
- Monitoring and analyzing conversion funnels
- flawless integration with instruments for analytics
Paying:
- Paid plans start at $39 a month; free plans provide few features.
Mouseflow

With its capacity to automatically record 100% of website traffic and create six distinct kinds of heatmaps—including click, movement, and attention maps—Mouseflow really shines. The funnel report—which tracks visitor drop-off during the conversion process—is one of its strongest strengths. Session replays are another feature of Mouseflow that let you view individual user sessions and grasp their experience more fully. It also offers strong segmentation tools so you can split data by nation, device, browser, and more.
Vodafone, Continent, New Balance, and Philips are the main customers.
Fundamental Characteristics:
- Six heat map varieties—click, scroll, attention, movement, etc.
- Session replays for thorough behavior study
- Funnel study to find conversion drop-off points
- Advanced user demographic segmentation
Price:
- Starts at $24 a month and has a free limited feature plan.
Glassbox

Using artificial intelligence-driven analytics, Glassbox is an enterprise-level tool offering thorough understanding of user activity. Its interactive heatmaps let you see the whole consumer journey and highlight how user behavior affects corporate indicators including revenue and conversions. The artificial intelligence features of the platform can forecast user behavior trends, so provide useful information to maximize the company results and user experience. Glassbox also enables thorough session replays so you may explore certain user journeys and pinpoint areas of conflict.
Glassbox customers are Purina, Air Canada, Bank Leumi, SoFi, and Marriott.
Key Attributes:
- Interactive hotmaps driven by artificial intelligence
- Complete awareness of the consumer journey
- Revenue impact study grounded on user interactions
- Predictive analytics advanced in artificial intelligence
Paying:
- Custom price usually for larger companies, catered to corporate demands.
Hotjar
One of the most often utilized heatmap tools available, Hotjar is used by companies of all kinds to see user interactions. Its heatmaps reveal where visitors click, scroll, and move on a website, therefore guiding the identification of which aspects draw attention and which create conflict. Hotjar gives companies a complete picture of the user experience by additionally providing surveys, feedback tools, and session records. Even non-technical people will find it simple to apply given its user-friendly design. UX research favors Hotjar since it can gather both qualitative and quantitative data, therefore strengthening it.
The world’s largest companies use Hotjar heatmaps – Adobe, Columbia, Microsoft, HubSpot and Panasonic.
Main characteristics:
- Heatmaps for click, scroll, and movement.
- User feedback instruments and session recording tools
- Survey integration for qualitative insights
- Simple enough interface fit for every team member.
Costs:
- Basic free plan offered; premium options start at $39/month.
Crazy Egg
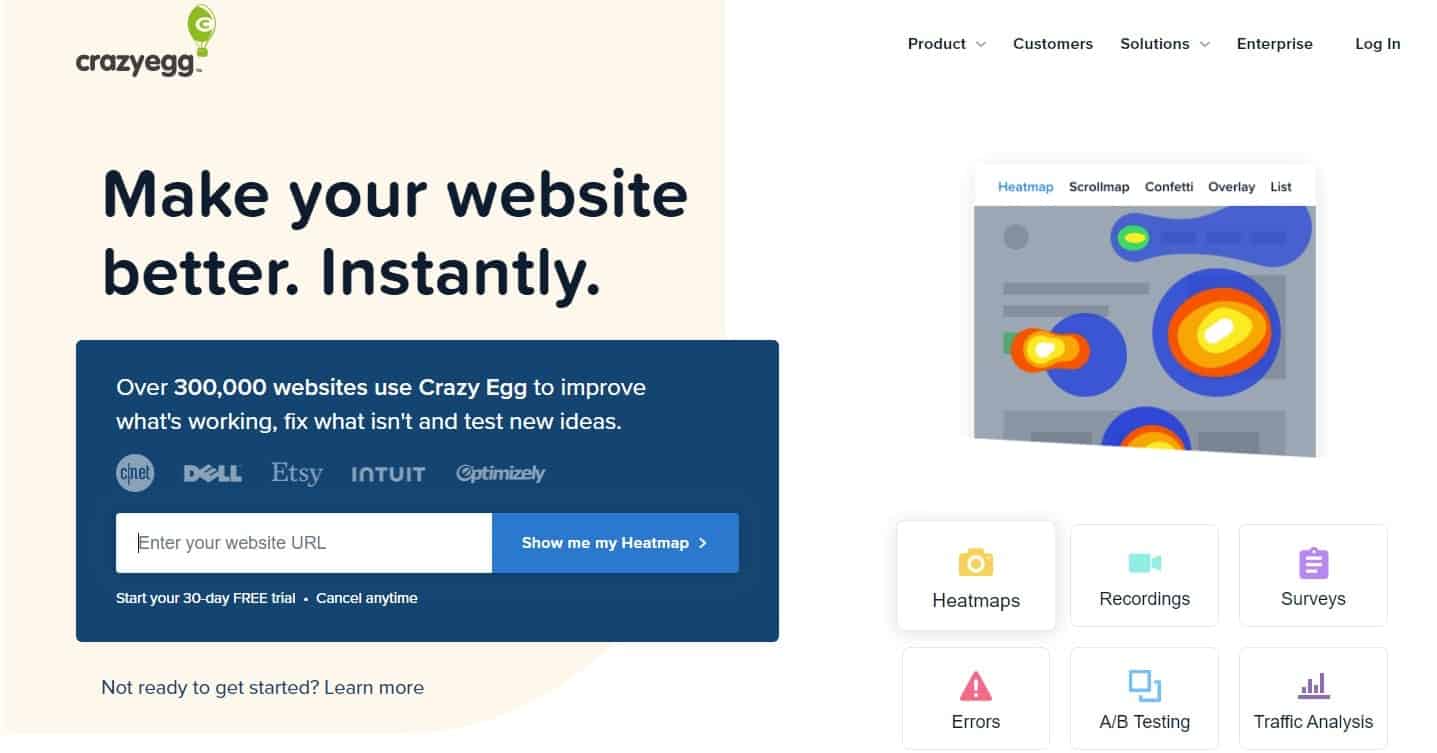
Five kinds of visual reports—heatmap, scrollmap, confetti, overlay, and list report—are offered by Crazy Egg’s complete heatmap website tool. These visuals help you to grasp real-time user interaction with your website. Since it splits clicks by source, the confetti report is very helpful in guiding your understanding of traffic source. Additionally providing A/B testing tools, Crazy Egg lets you test design changes depending on heatmap data. Its click-tracking feature helps you to find underperformance on your website, thereby guaranteeing improved user experience.
Intuit, Wall Monkeys, Sendible, RadioFreeEurope, and Miller&Smith use it.
Salient characteristics:
- Five kinds of heatmaps (click, scroll, confetti, etc.).
- Site element optimization with A/B testing
- Confetti reports traffic source-based click segmentation.
- Simple graphic reports for rapid understanding
Costs:
- Following a 30-day free trial, plans start at $24/month.
UXcam
With its heatmap analytics—which are especially suited for mobile apps and websites—UXcam offers a thorough look at the user experience. It provides a 360-degree perspective of user behavior ranging from touch heatmaps to gesture detection. Perfect for mobile-first companies, UXcam records exact information on user interactions like pinch, zoom, and tap. Its comprehensive session recordings let you examine user navigation of your app or website, therefore pointing up areas of friction and regions needing development. UXcam also connects with other analytics systems, therefore facilitating the combination of ideas.
The customer list includes Housing.com, Inspire, Costa Coffee, PlaceMakers and Rappi.
Main Characteristics:
- Mobile app gesture and touch heatmaps
- Comprehensive session replays with gesture tracking 360-degree perspective of user movement.
- Integration with Google Analytics and other analytics systems:
Pricing
- Custom pricing based on requirements of your app or website.
VWO
Comprising heatmaps with A/B testing and conversion optimization, VWO is a complete platform. Tracking every action users take on your website, its heatmaps reveal areas of success and failure. Heatmap reports can be downloaded and distributed among your staff for group decisions. VWO excels in its ability to combine heatmaps with multivariate and split testing so that hypotheses may be directly tested using heat map findings. Advanced segmentation also lets you divide user behavior by several demographics, devices, and traffic sources.
Amway, Timberland, Mindshare, Sophos, and Carrier are the main customers.
Main characteristics:
- Real-time tracking in heatmap reports; integration of multivariate testing and A/B testing
- Advanced segmentation to provide more profound understanding
- Downloadable heat maps for team work
Paying:
- Beginning at $169 a month, offers a 30-day free trial.
Attention Insight
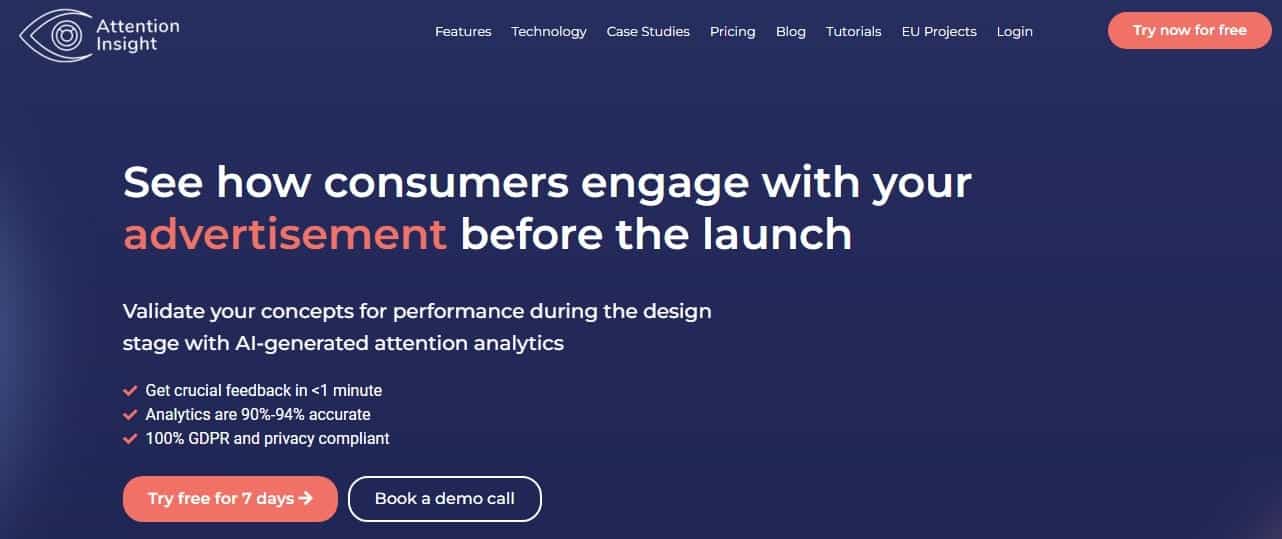
Using artificial intelligence, the heatmap tool Attention Insight forecasts where people would most likely concentrate their attention on a website. By creating attention maps and focus zones based on AI models, our predictive heatmaps let companies evaluate designs before they go live. The tool provides insightful analysis of how consumers view and engage with your material by computing clarity ratings and attention percentages for several areas of a webpage. Design comparison tools provided by Attention Insight can help you to evaluate several iterations of a page to find which one grabs more interest.
The main customers are Ryanair, Omnisend, NOZ Digital, and others.
Important characteristics:
- Predictive heat maps driven by artificial intelligence
- Calculations of clarity and attention score
- Design comparison for a binary search test
- perceptive analysis of user areas of emphasis
Costs:
- Starts at $19 a month; there is a free trial.
Fullstory
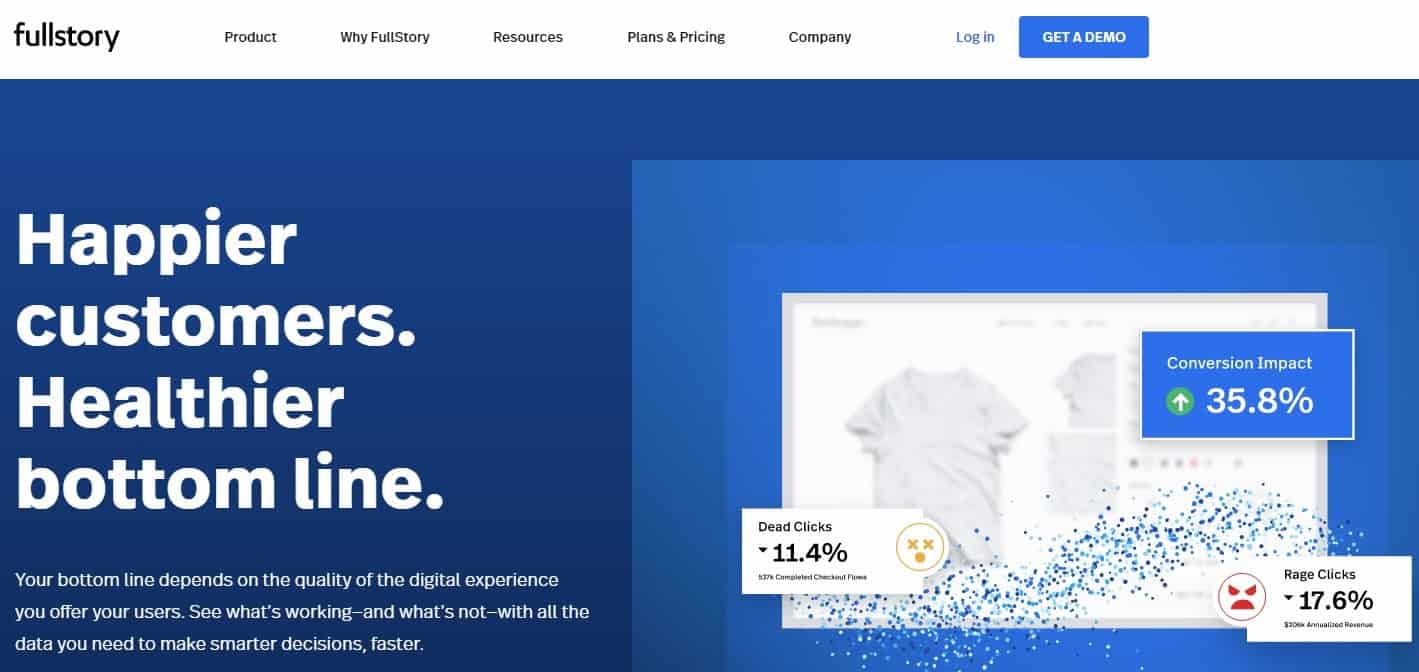
Heatmaps, session replays, and product analytics among other digital experience technologies are available from Fullstory. Its very detailed heatmaps allow one to alter them depending on user activity patterns. Fullstory shines also in offering real-time data, which lets you monitor user interactions as they occur. Its session replays are especially strong and provide a detailed perspective of unique user paths. Identification of UX bottlenecks and data-driven usability enhancement for your website depend mainly on fullstory.
The main customers are HBC, Lowe’s, Wistia, KeyBank and Salesforce.
Essential Characteristics:
- Heat map tracking in real time
- Detailed session replays with user journey insights
- Integration with product analytics
- Customizable heatmaps depending on user behavior
Pricing:
- Free trial available; bespoke price upon request.
LogRocket
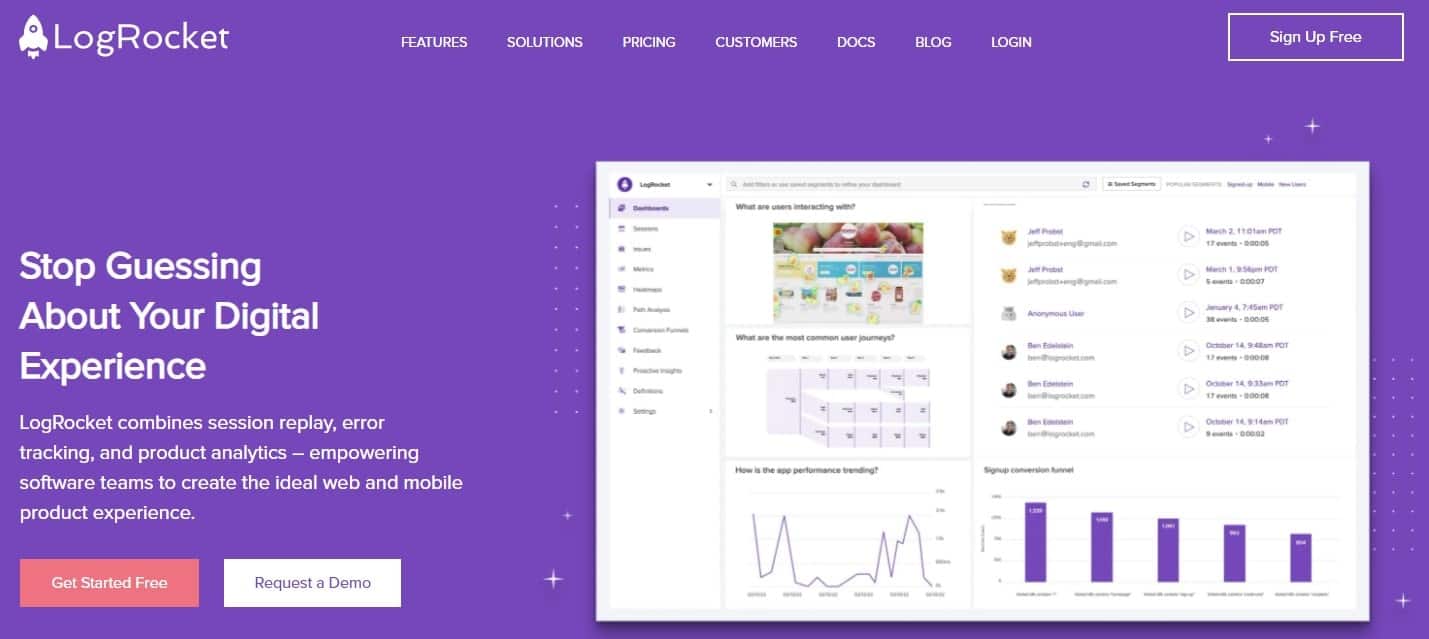
LogRocket creates a whole picture of user interactions on your website by combining heatmaps with session replays and product statistics. Its Conversion Rate Heatmaps give you real-time tracking of how well various components on your site generate conversions, so offering useful information for optimization. LogRocket also includes session replays and error tracking, which helps one quickly spot technical problems possibly generating user conflict. LogRocket’s go-to tool for conversion optimization is real-time measurements combined with thorough data analysis.
The main customers are Rippling, Pinterest, Brex, SwissLife and WholeFoods.
Important traits:
- Conversion % Heatmaps for monitoring performance.
- Session replays and error recording
- Real-time user engagement measures
- Product analytics for a whole perspective on user behavior
Pricing:
- There is a free trial; premium subscriptions run $99 a month.
1. Scroll Depth Analysis
Most websites struggle with UI fundamentals and ignore this critical element during the website design and development phase. They have pageviews, but the conversions are very few. Some eCommerce websites have misplaced hero images, while others can’t decide whether to go with shorter or longer content.
A scroll heatmap, which works on desktop and mobile devices, is the best utility tool to determine the proportion of scrolls visitors perform before they leave the webpage or website. They can help you select the best hero images, optimum content length, and ideal placeholder for your CTA on the website.
Unscramblex has made the best use of scroll maps. When a site visitor enters the unscrambled letters into their search bar, Unscramblex displays a list of the highest-scoring words. These words have been identified and ranked using the scroll maps. And how does it work? Let’s take a look at it.
Scroll maps are color-coded, and when a customer stops scrolling, a sudden change of coloring indicates that the visitor has come to a logical end. This logical end is a section of the website where the software no longer sees a logical reason to continue scrolling.
After identifying the words where the scrolling stopped, they are labeled as the most sought-after words and displayed at the top.
Use scroll maps to:
- Highlight false floor or false bottoms
- Identify whether or not visitors reach the content below the fold
- Identify where visitors are spending the most time and where they are losing interest
- Calculate the scroll depth and ideal length of a webpage after which visitors don’t scroll down
- Spot the most suitable area for pricing and other key information or elements, like CTAs.
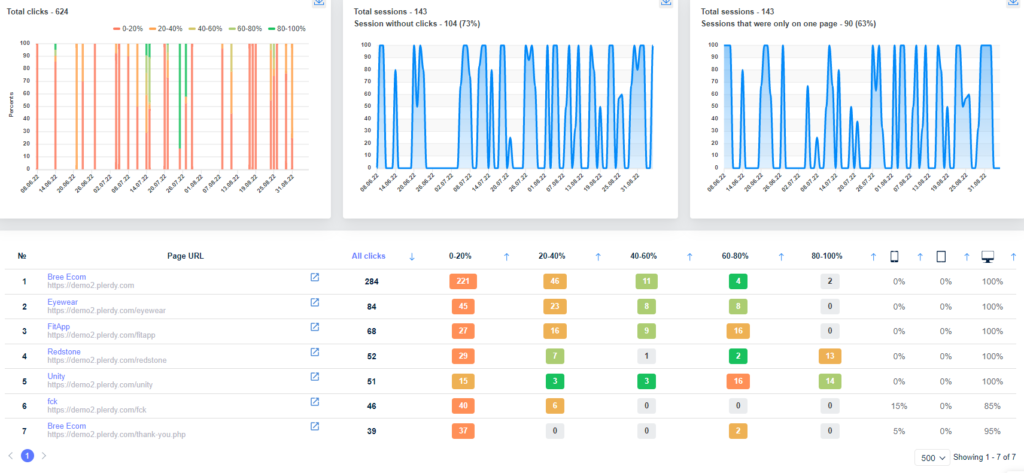
Plerdy heatmap tools also allow you to measure scroll depth parameters. With their help, you can get a detailed report on the scrolling zones. The software collects data and forms a report based on several aspects:
- Scroll depth per device. It will inform how users reach your resource – desktop, smartphone or tablet.
- Scroll depth per page. Heatmaps track and display visitors’ activity on landing pages, long pages and across product categories.
You can make appropriate optimization solutions based on the received data and boost retention.
2. Heatmap Analysis Based on Segmentations
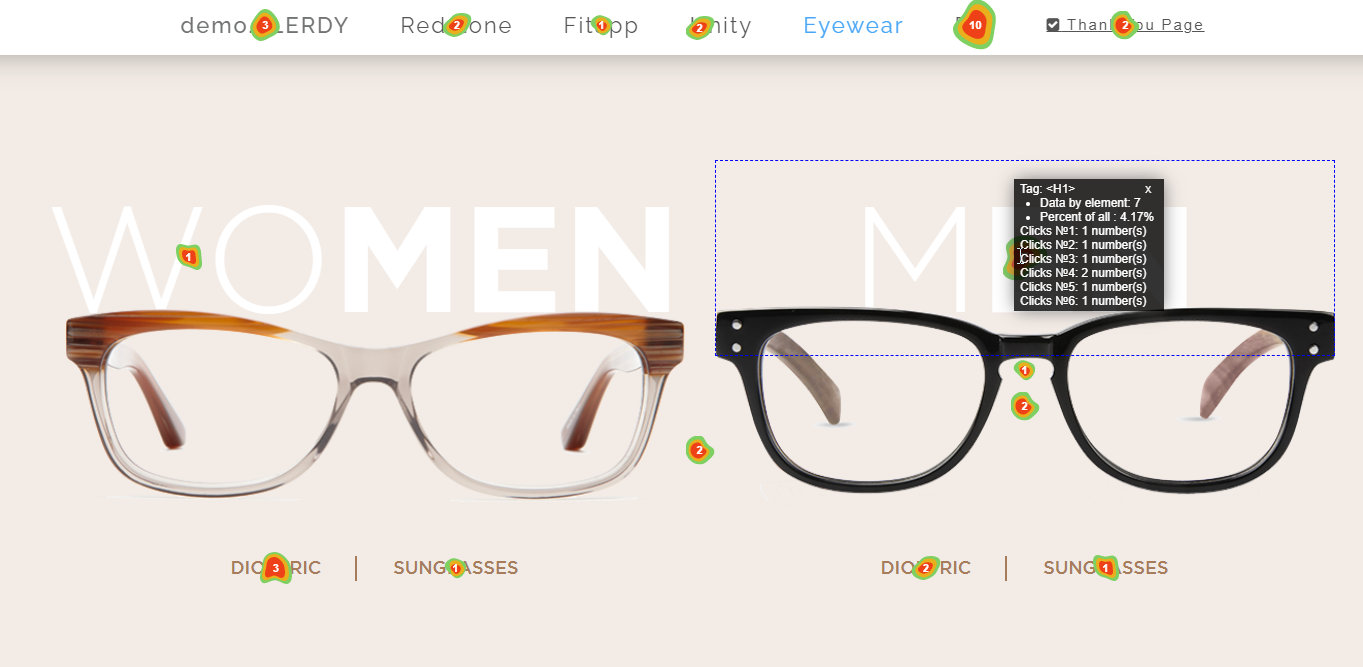
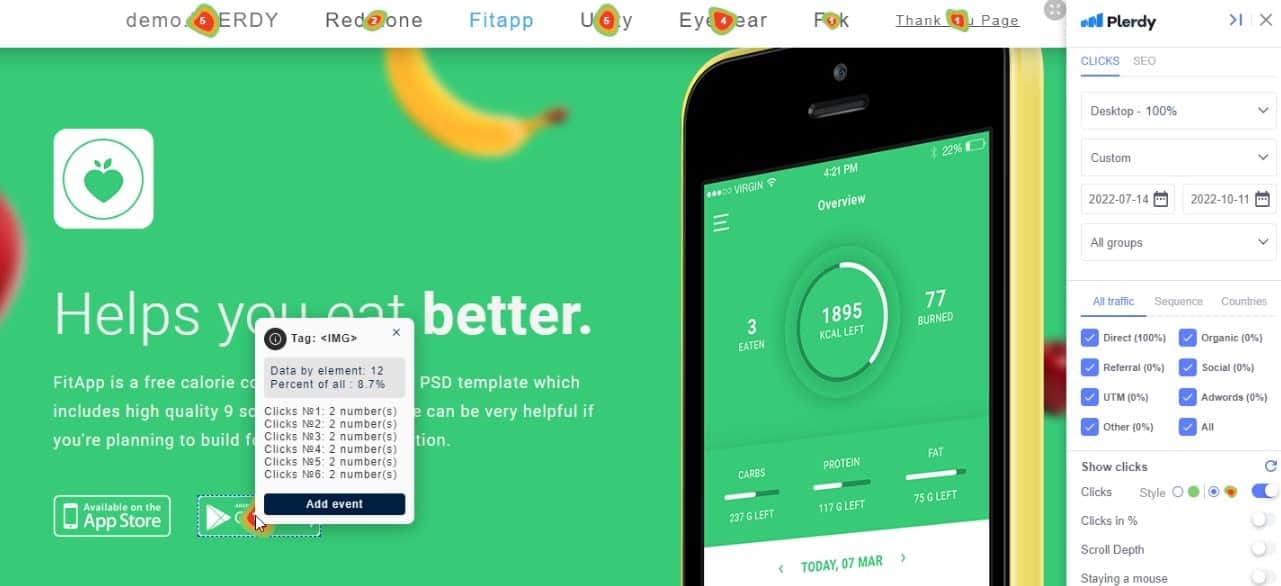
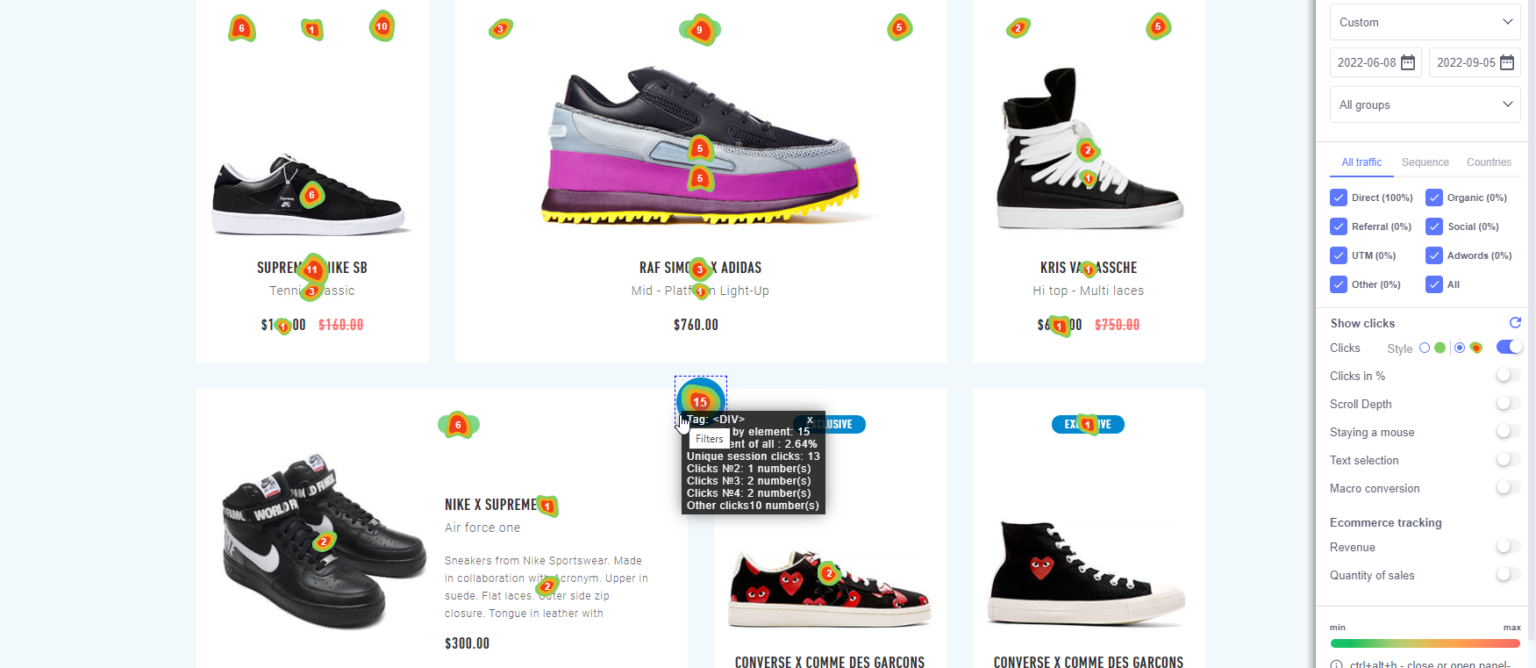
Comprising individual clicks from visitors as colored dots, the confetti heatmap report is a more detailed form of a conventional heat map website. Finding the individual regions consumers engage with is especially helpful using this high-resolution map. Click maps in Plerdy broadcast every click as it occurs and operate in real-time. This function guarantees that you are always seeing the most current activity on your website, thereby enabling you to decide right away about user interface (UI) changes and design tweaks.
The confetti heat map’s ability to highlight non-clickable features visitors still try to interact with is a big advantage. Many times, users click on these elements only to find disappointment when nothing changes. Increased bounce rates and a bad user experience can follow from this.
Take a user on a website providing auto repair services, for instance. The visitor is seeking for a local service in a particular city. They come upon a call-to- action (CTA) box mentioning their city while looking about. Expecting to be sent to a page with contact information and pricing, they click on it but since the element isn’t clickable the visitor feels annoyed and quits the website. You may rapidly find such unclickable items and provide appropriate links using a confetti heat map report to enhance the user experience.
Benefits of Heatmaps for Website Optimization

Heatmaps give important new perspectives on user interaction with your website. Heatmaps may greatly increase the usability of your site in the following three main areas:
- Monitoring Image Interactions: You can find trends in user behavior by noting which images consumers click on. If some images get more views than others, for instance, you can add pertinent links to those images and change their placement to more closely fit user expectations.
- Heatmaps enable one to spot spots where visitors would expect to find connections but do not. Clickable vs. non-clickable elements Analyzing click behavior on non-clickable components helps you to make changes adding links where suitable to enhance website navigation and lower user annoyance.
- Heatmaps can help you to see whether users are interacting with your call to action (CTA) buttons. Should visitors click in locations lacking a CTA, this could suggest poor CTA positioning. Using heatmap data to guide your design will help to improve positioning and increase interaction rates.
- Heatmaps can highlight the most often clicked menu items by users. For example, a visitor clicking on a “Continue” button on the cart page expects to return to a product listing but is instead sent to the checkout process, therefore indicating a mismatch between user expectations and the navigation of the website. On sites like Shopify or WooCommerce, where the default structure often does not match user needs, this is typical.
Using website heatmaps will enable companies to efficiently monitor and evaluate user activity, hence guiding data-driven decisions enhancing user experience (UX). Heatmaps offer actionable insights that, whether they involve changing the navigation, adding links, or rearranging CTAs, help to improve conversions and a more fulfilling user experience.
Like Plerdy or others, the correct heatmap tool will track interactions to guarantee that your website develops depending on user wants. This makes your site more user-friendly and efficient since it lowers bounce rates, boosts conversions, and helps match the architecture of your website with what your customers anticipate.
3. Mouse Tracking
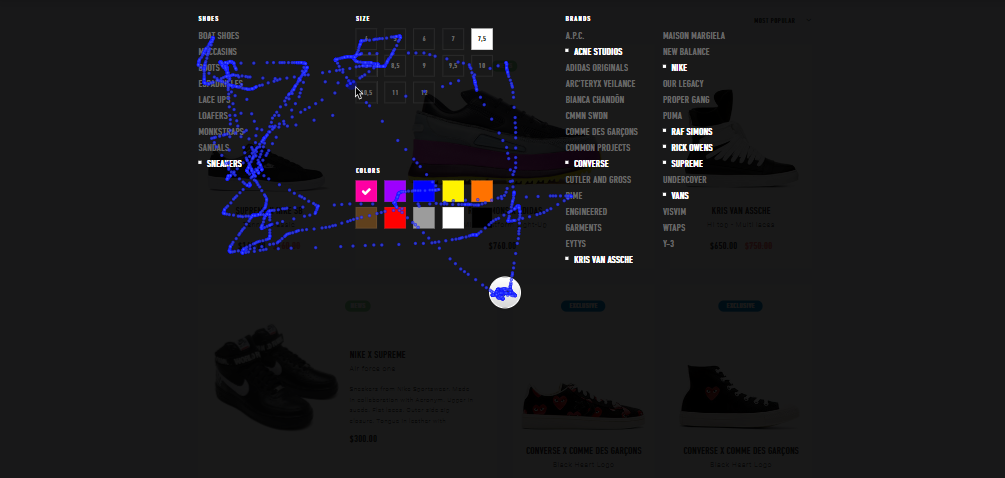
A mouse tracking heatmap shows where visitors keep their cursor the most. These mobile apps are Hover Maps, Attention Heatmaps, and Move Maps. Mouse tracking is also a part of the Plerdy heatmap toolkit.
You can use mouse tracking heatmaps to:
- Highlight the sections where visitors hang around the most and place content appropriately. For example, these sections can include primary CTA, necessary advertisements, etc.
- Collect insights on where a visitor is looking when visiting a web page by analyzing where their mouse pauses and where they hover.
But one thing to note is that the rule mentioned above may not apply to technical blogs on WordPress, for instance. It is because of something called ‘parkers,’ which are visitors who place their cursor in one spot regardless of what they are reading or when entering a field on the site.
4. Eye-Tracking

Most people often confuse mouse-tracking heatmaps with eye-tracking heatmaps. This software does not rely on mouse cursors to highlight the website’s usability but on where the eyeballs are looking at any given moment.
This data allows you to identify the most attractive page elements for visitors: “hot” and “cold” spots.
Humans are inherently biased regarding their sight and tend to use it more than any other sense. The same pattern works when browsing through a website.
The eye-tracking heatmaps are particularly handy if you run a website that offers updates on the stock market. For example, using a heatmap tool, you can discover that the users look mainly at the top left corner of the screen to find information about a particular stock and rarely at the bottom right corner.
This fact is something you can capitalize on. A great example is when you showcase high-yield dividend stocks, you can add details investors care about, such as market cap, dividend yield, and annual payouts, to the top left corner.
Utilizing the appropriate platform will improve the user experience and enable them to make more informed investments.
You can use eye-tracking heatmap tools to:
- Highlight where visitors are looking at most on your website pages for information.
- Understand if a visitors’ gaze is being distracted by any element (visual or textual) on the page.
- Figure out the most attention-grabbing sections of the page by tracking visitors’ gaze patterns to place all essential content and images.
Top 11 Benefits of Using Website Heatmap Analytics Tools
Now that you know the different website heatmap software, it is vital to know why they are such a critical t web analytics feature today. This software has many benefits, including the following ones:
1. Detecting and Highlighting Issues in Your Website
Perhaps the most significant advantage of using heatmap tools is highlighting any issues in your website since its construction.
Depending on the specific heatmap tools you have at your disposal, you can detect weak areas directly or through derivation. Data segmentation can help analyze repetitive clicks or similar irregularities to find problems.
2. Instant Actionable Reports
Not only do heatmaps provide accurate results, but they also give them in real time. The user activity is recorded instantly and given to the reviewer without delay.
With instant heatmap reports, website owners can highlight necessary data immediately and conduct A/B testing to help select the best versions of their website.
3. Pinpoint Results
Heatmaps break down every aspect of the user’s activity into categories. It can help check the number of clicks, the visibility of the website, and the overall time the users spend on each part of the website.
A website heatmap tool, similar to how a good team chat software can help simplify a company’s communication process, can help streamline the online resources available on the website.
4. Clear Visual Representation
Heatmaps tools are incredibly convenient for most people as they do not show data in a complex and confusing numerical manner. Instead, they offer you the analysis in color-coded visual representation. As a result, data visualization becomes very easy to understand for everyone involved.
5. User Activity Is Easy to Understand
Heatmaps simplify the otherwise complicated dynamics of your site, using simple visual representations and instant updates. You can learn how users navigate your site and make changes accordingly.
6. Integration with Add-Ons and Tools
Online tools usually have the same issue facing them. These tools are intrusive or exclusive to particular operating systems or browsers and cannot be used in other mediums. It is not the case for heat map for website tools, which are compatible with any browser or operating system.
Website owners can then focus on improving their website rather than tinker with the exact specifications of the software to get it to work.
7. Heatmaps Guide to Improve Your Site
Heatmap data is the most user-friendly tool a website owner can use for funnel analysis and improving their website. The software functions as an intelligent pattern, and instead of outsourcing assistance, you can learn from heatmaps and make immediate changes.
After analyzing the information a heatmap tool provides, you can use it as input data and add it to image recognition software, which can then identify areas of your website requiring maintenance or overhaul.
8. Categorization for Better Understanding
Website heatmaps are categorized based on their actions to assess user activity. These tools include click heatmaps, scroll heatmaps, and many others. Each can specifically help with conversion rate optimization and present session recordings and replays to form better conversion funnels.
These specific heatmaps collect data on different aspects of a website. Click web heatmaps and scroll heatmaps, in particular, have vastly different data sets, but both benefit a better understanding of a website’s analytics.
9. Heatmaps Highlight the Appealing Parts of Your Site
You may think some part of your site is appealing, but users don’t specifically like it. But, on the other hand, they may appreciate something you haven’t even given attention to. Heatmaps can point out those potential areas via form analytics and enable you to improve them…
The less appealing parts of a website are typically the ones visitors interact with the least. These can be images, texts, or entire pages of a website that visitors do not engage with, which can increase website turnover and bounce rates. Heatmap tools are essential to keep these numbers minimum and promote better website marketability.
10. Heatmaps Make the Visitor’s Experience Better
The crux of this whole matter of using heatmaps is to improve the user’s experience. Heatmaps guide you to enhance specific areas and tone down others so visitors can have a comfortable navigation experience.
Heatmaps can help redirect the focus of a website owner to the visitors and ensure the best optimization strategies to promote an optimistic outlook for the website. By creating more engaging content and placing elements that visitors appreciate, the overall visitor experience improves.
11. Heatmaps Help Increase the Value of Your Business
In a world where business exits have become a norm, heatmap software is one of the essential tools that can help increase the value of an online business. These tools let you improve the website’s overall user experience and provide recommendations on key aspects of the website.
With easy navigation, better CTA, and reduced friction at the checkout process, heatmap tools skyrocket the conversion rate, resulting in increased profits and, thus, improved business valuation.
Conclusion
So there you have it.
The utility of website visitor heatmap tools is undeniable, and they form significant parts of most website optimization strategies. If you’ve never used software of this sort, it is the right time to give it a test run. And with continued use, website heatmap tools will become a major asset to your business.
We hope you learned a lot about the best heatmap software today. Using appropriate webpage heatmap tools like Plerdy is the key to alleviating your business and minimizing website UI/UX errors.
Plerdy provides a heatmap tool and many other CRO tools that help you change your website for a higher conversion rate by gathering data about the website and its users.
Visit our website to learn how we can help you convert your visitors into loyal customers.