
Explore the colorful cosmos of heatmaps and release the possibilities presented by visualized data. A heatmap is a useful tool for illustrating the intensity of heat values by means of color fluctuations.
In this usage, heat refers not always to temperature. It may be user activity on a website, event focus, or any metric you wish to emphasize.
Heatmaps have mostly features:
- Strong color spectrum emphasizes variations in data;
- Intuitive knowledge helps one to quickly grasp information.
- Flexible applicability ranging from geographical sites to websites.
Heatmaps help companies to better grasp customer behavior, preferences, and more. If you want to improve your CRO and UX plans, use the Plerdy tool, a trustworthy friend in visualizing important data. Convert unprocessed data into a vibrant, educational heatmap and guide your initiatives with knowledge and confidence.
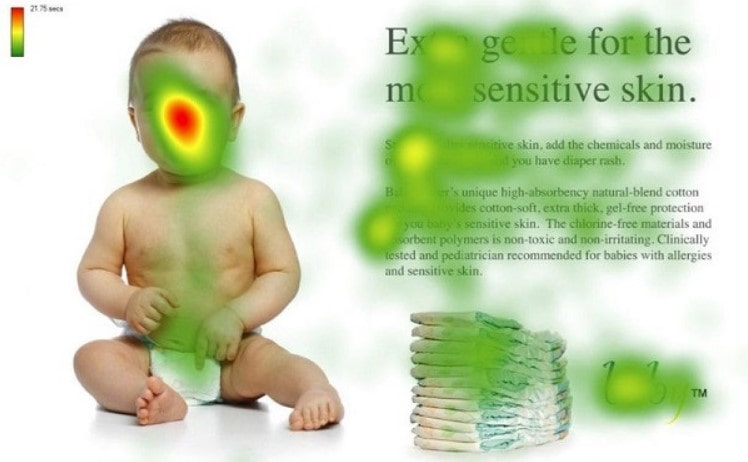
What is a Heatmap?
Considered as visual aids, website heatmaps vividly depict user activities on a web page. Imagine a digital canvas where places of great activity exude heat and reveal flaming reds and yellows. Less often visited locations cool down, usually under blues or green shade. The word “heatmap” comes from these heat patterns.
Diving into specifics:
- Heat: Indicates user click or movement density. Hotter zones show places of great interaction.
- On your web page, create an overlaid heat map that reflects this heat and highlights user most often interacting areas.
- Map: The structural design that elegantly connects with your website to convert unprocessed data into graphic understanding.
E-commerce sites might detect hotspots around product photos or checkout buttons, for example; blogs might find heat focused on interesting headlines or share buttons. Using heatmap information, webmasters can identify areas where their material excels and areas requiring changes. This dynamic team of heat and map data drives web designers to improve their sites so they really appeal to their audience.
Benefits of Using Heatmaps
Heatmaps let companies make data-driven decisions by providing a striking means of seeing user behavior. Heatmaps on websites emphasize high-traffic areas and point out underperforming sections by turning difficult data into an understandable visual format.
Heatmaps provide important advantages including:
- Heatmaps show how users interact with your site, so facilitating the optimization of navigation, content placement, and general design streamlining process.
- Analyzing heatmaps helps companies strategically place important components like calls-to- action (CTAs) in regions with strong user involvement, hence increasing conversions.
- Heatmaps provide focused changes by helping to highlight problems such areas of low engagement or confusing design.
- Heatmaps show unambiguous data on user preferences, therefore guiding A/B testing initiatives by indicating which page versions perform better.
- Experts at Nielsen Norman Group claim that improving site performance and grasping user behavior depend on heatmaps. Heatmaps with actionable insights can greatly increase the design and strategy’s potency of your website.
Heatmaps let companies design more interesting, user-friendly websites that improve performance and customer satisfaction by means of bettering of course
Different Types of Website Heatmaps
Website heatmaps have developed to provide several insights, each suited to highlight particular user interactions. These graphic aids use heat and map data to highlight places of interest. Let’s deconstruct the main heatmap categories:
- Click Heatmaps: Emphasize the areas visitors most often click on. Online stores, for example, might locate these locations around promotional banners or product listings.
- Detail how far people slide down a page in a scroll heat map. Many times, bloggers use these insights to evaluate the popularity of their material.
- Move Heatmaps: Mirror a user’s cursor across a page. This helps service-based websites decide which areas of their landing pages pique users’ attention.
- Measure user time spent on particular regions, so providing content authors with an advantage in maximizing their effort.
Businesses from several niches can delve deeply into user behavior by combining these heatmap kinds, therefore honing their strategy depending on the interaction between heat and map.
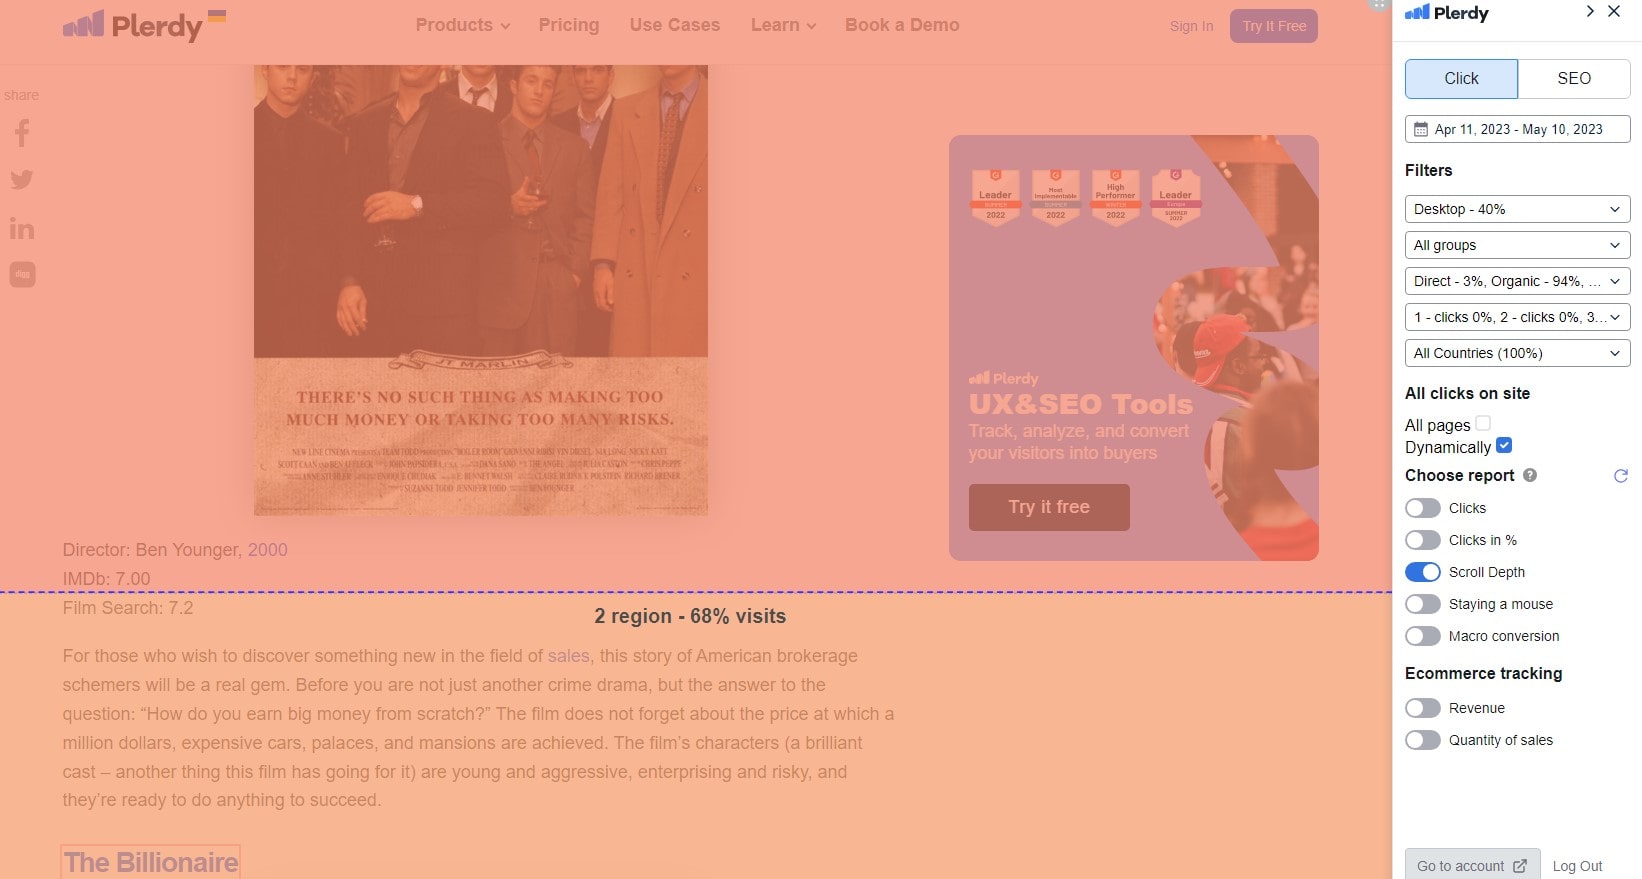
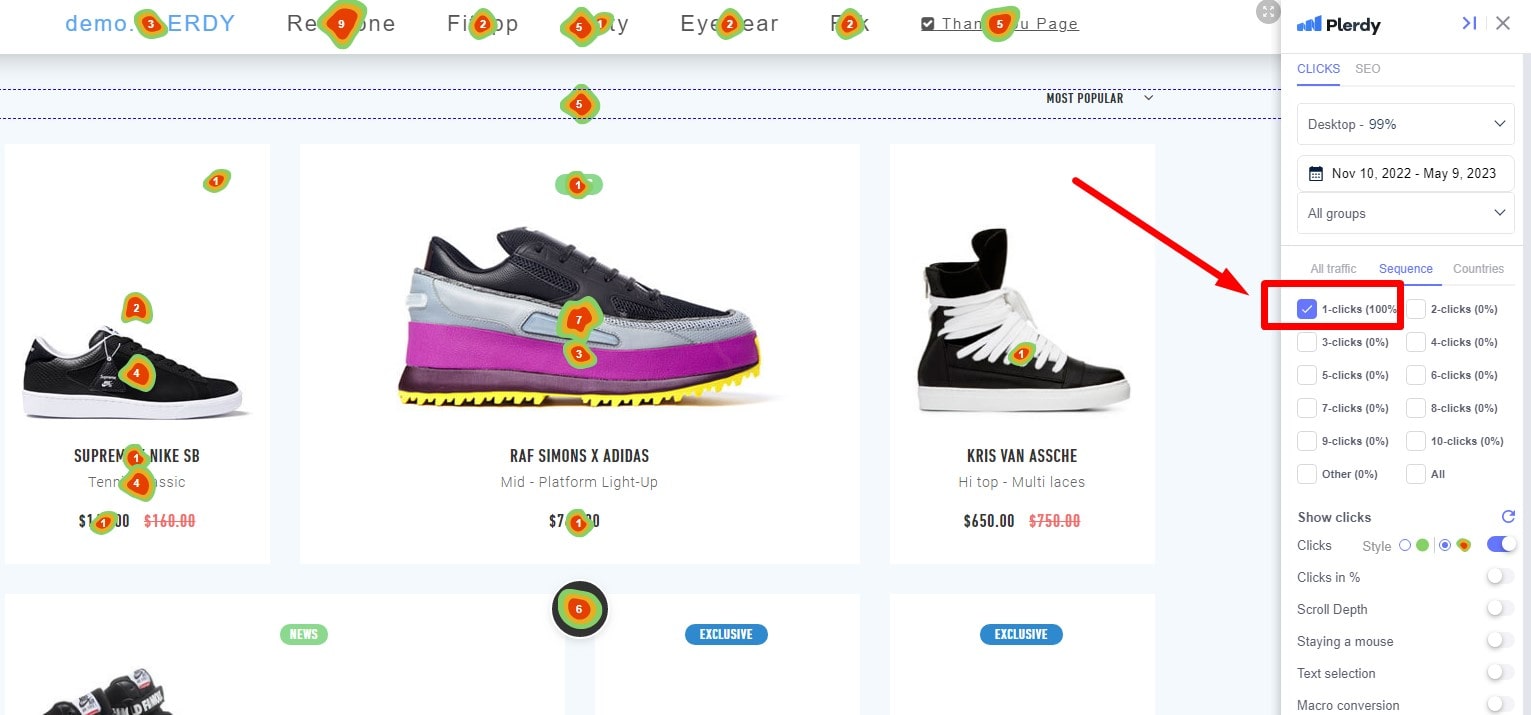
Click Heatmaps

Explore the universe of click heatmaps to find a wealth of ideas. These heatmaps show where users most wander on a website by turning unprocessed click data into vivid graphic depictions. With click frequency, the heat intensity increases and creates a clear map of user preferences.
Characteristics to weigh:
- Radiant dots displaying locations with maximum clicks provide companies with a clear road map for user interests by means of heat indicators.
- Variation in Color: Colors move from cold blues to flaming reds as the heat rises, hence stressing areas of maximum contact.
- Niche Uses: This heat map might highlight top-selling items for e-commerce sites. Digital publications could then find preferred stories or features.
Click heatmaps enable companies to improve their digital environments by using the combined power of heat and map, therefore customizing content to exactly fit user preferences.
Scroll Heatmaps
By tracking how far users travel down a page, scroll heatmaps probe user engagement. These heatmaps depict user journeys—where they linger and where they drop off—by their unique play of heat and hues. Heat and map data combined provides priceless information for optimizing site content.
Important considerations include:
- Areas with focused warmth show areas that enthrall guests with varying degrees of heat intensity.
- As colors soften, it reflects areas where user participation slows down.
- Online galleries could identify which works of art draw the most interest, while news sites could highlight popular stories.
Creating material that connects becomes easy when you have the data-rich environment of scroll heatmaps. Brands can increase deeper involvement by optimizing for places on the map with reduced heat, therefore guaranteeing their material doesn’t only skimming the surface but has a lasting effect.
Move Heatmaps
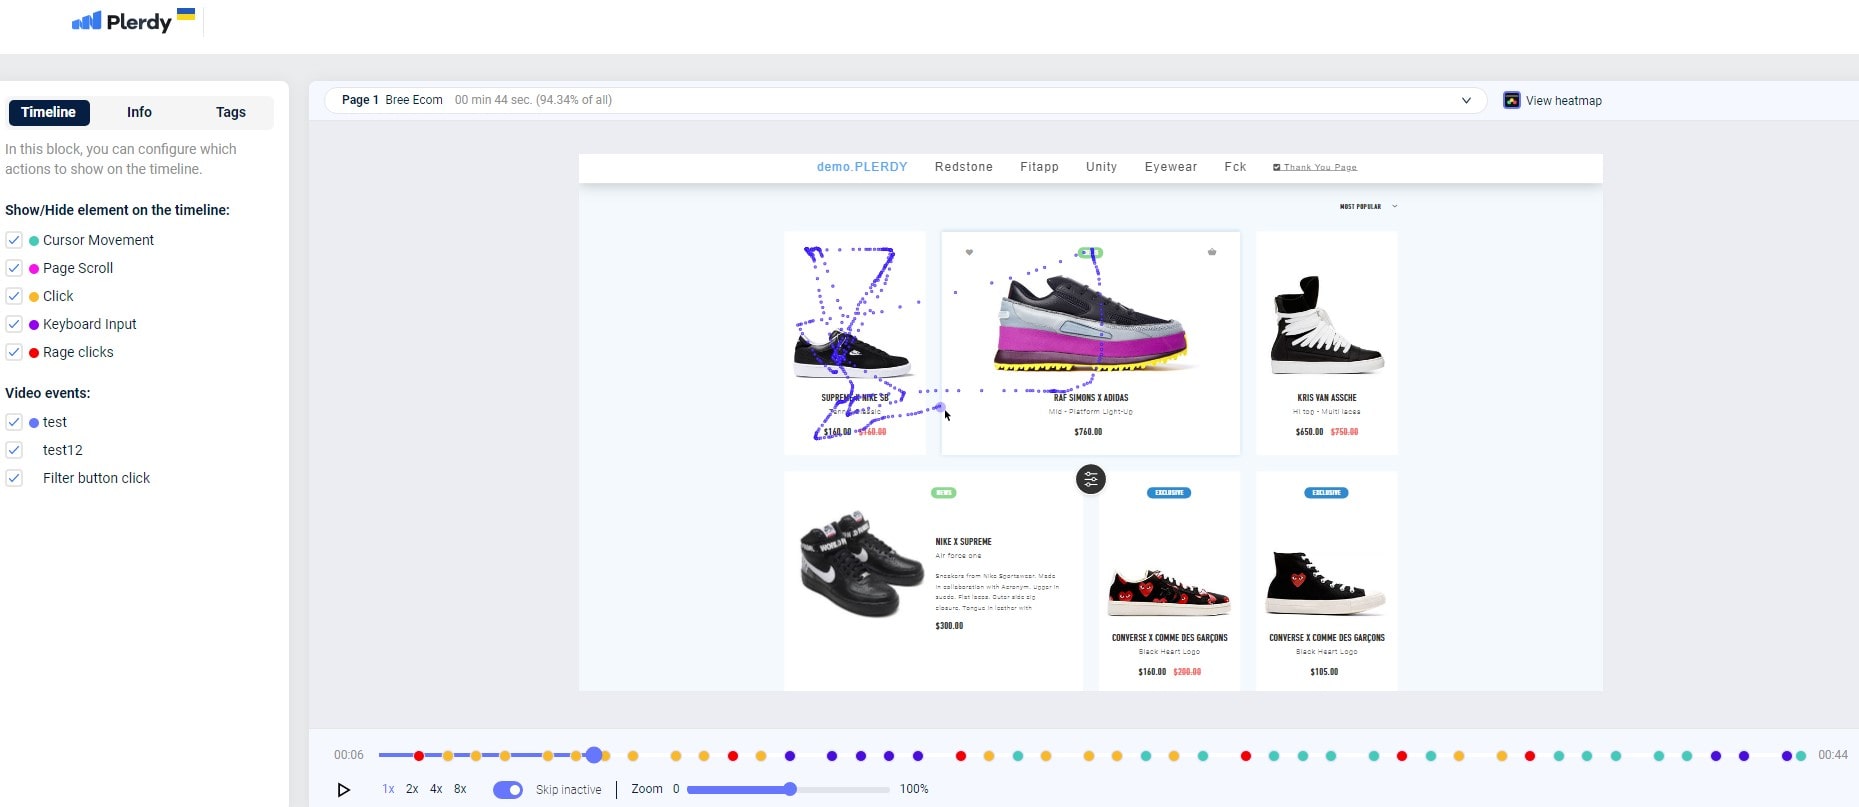
Track the dance of user cursors around a web canvas to create moving heatmaps. These dynamic heatmaps highlight places that captivate or involve visitors by interpreting cursor movement. Heat’s dance on the map highlights user pathways, therefore exposing both neglected areas and focal locations.
Important notes:
- Vibrant paths show regular cursor directions, therefore highlighting user flow and interest.
- Cold spots—that is, sections with less heat—indicate places maybe need zest or alteration.
- Heat might cluster around interactive product demos in a digital catalog and highlight interactive quizzes or infographics on educational websites.
Using the knowledge from motion heatmaps, companies can adjust their material such that it fits user behavior. Such minute map elements combined with the story of the heat enable site owners to create engaging, user-centric experiences.
Attention Heatmaps
Attention heatmaps highlight areas on a website where visitors’ concentration rests. These heatmaps turn time spent into a visual feast of heat and color on the map, therefore capturing the core of user interaction. Users spend more time on specific areas, thus the heat’s strength increases and those magnetic content components become visible.
Difficulties to value:
- Warmth blossoms where users pause to indicate materials that appeal to or fascinate them.
- Time-Color Spectrum: While transient glimpses simmer to cooler tones, prolonged focus yields intense hues.
- Heat could gather around popular video thumbnails on streaming platforms, but on recipe sites it might highlight trending foods or techniques.
Using the story spun by heat and map components, attention heatmaps give marketers the clarity to improve content quality. These realizations make it easy to match web experiences with audience preferences.
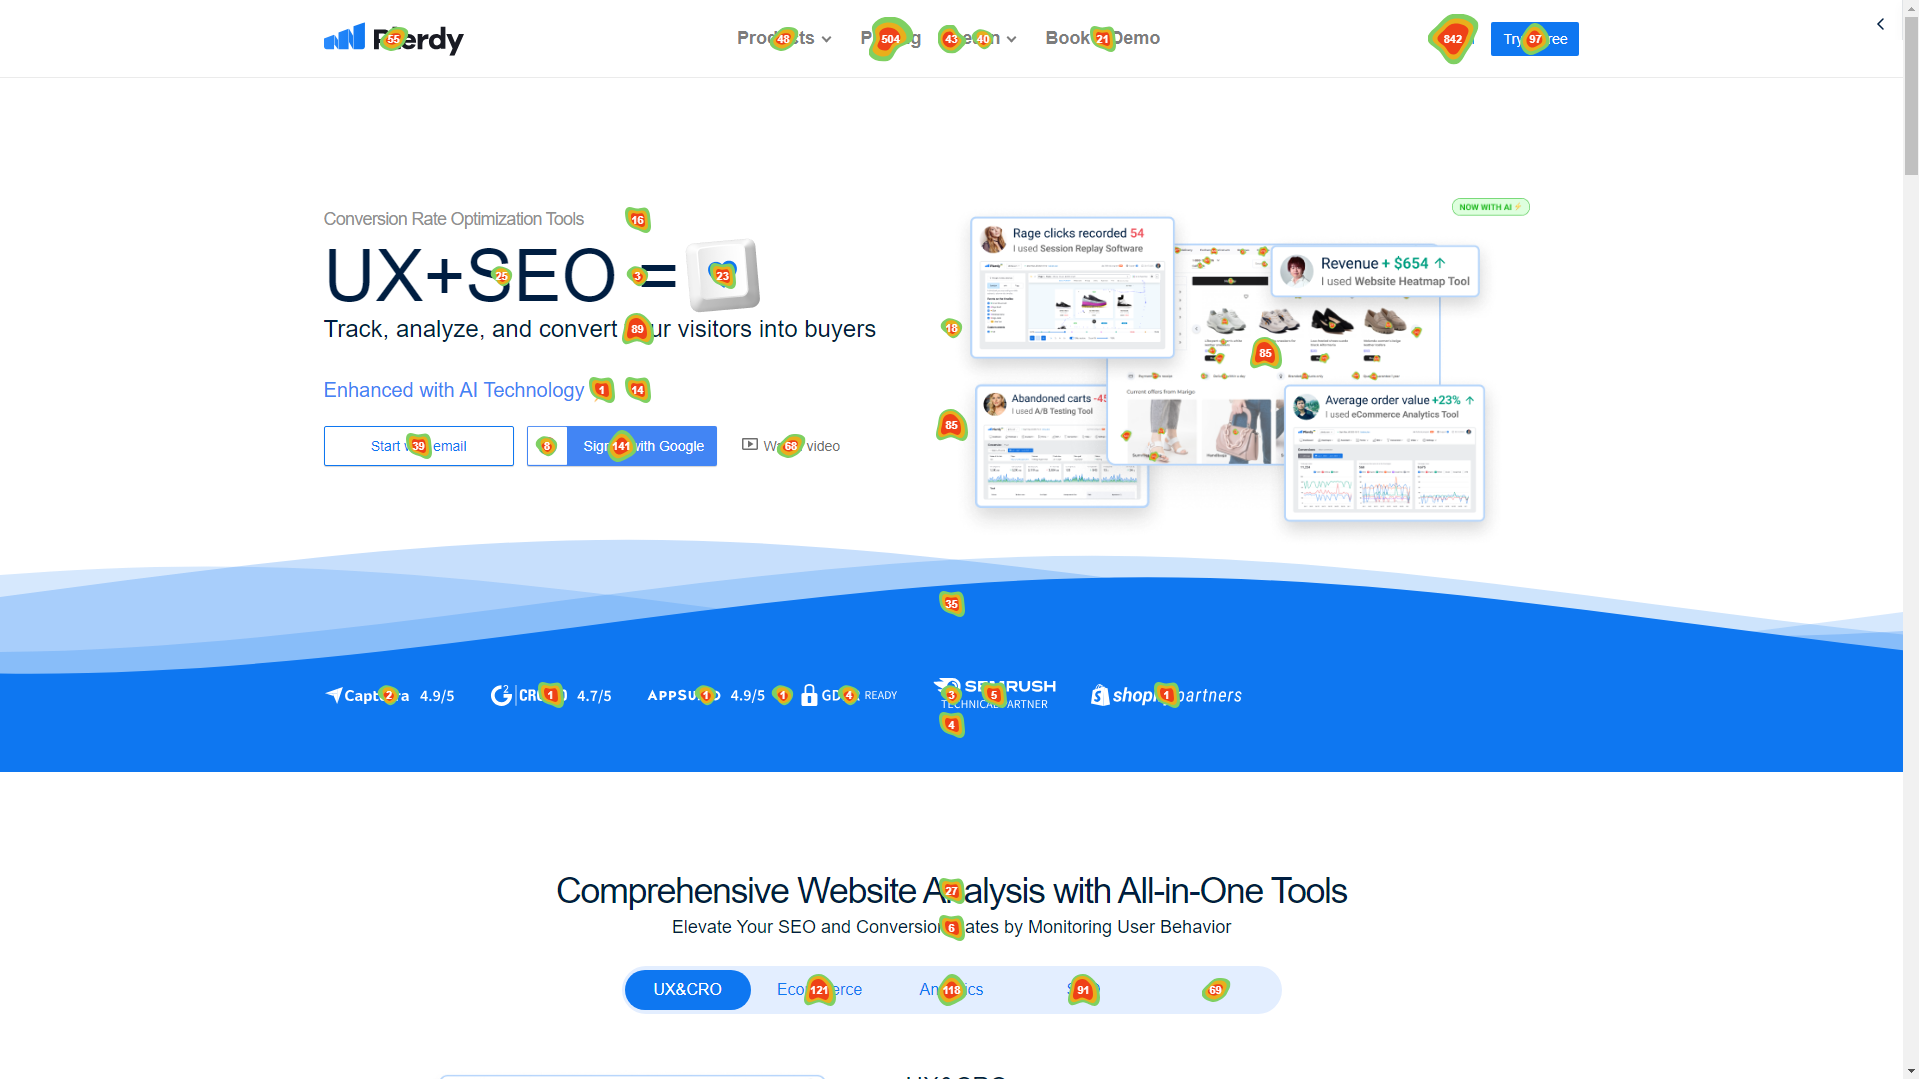
Unveiling the Plerdy Website Heatmap Tool: A Deep Dive into Web Insights
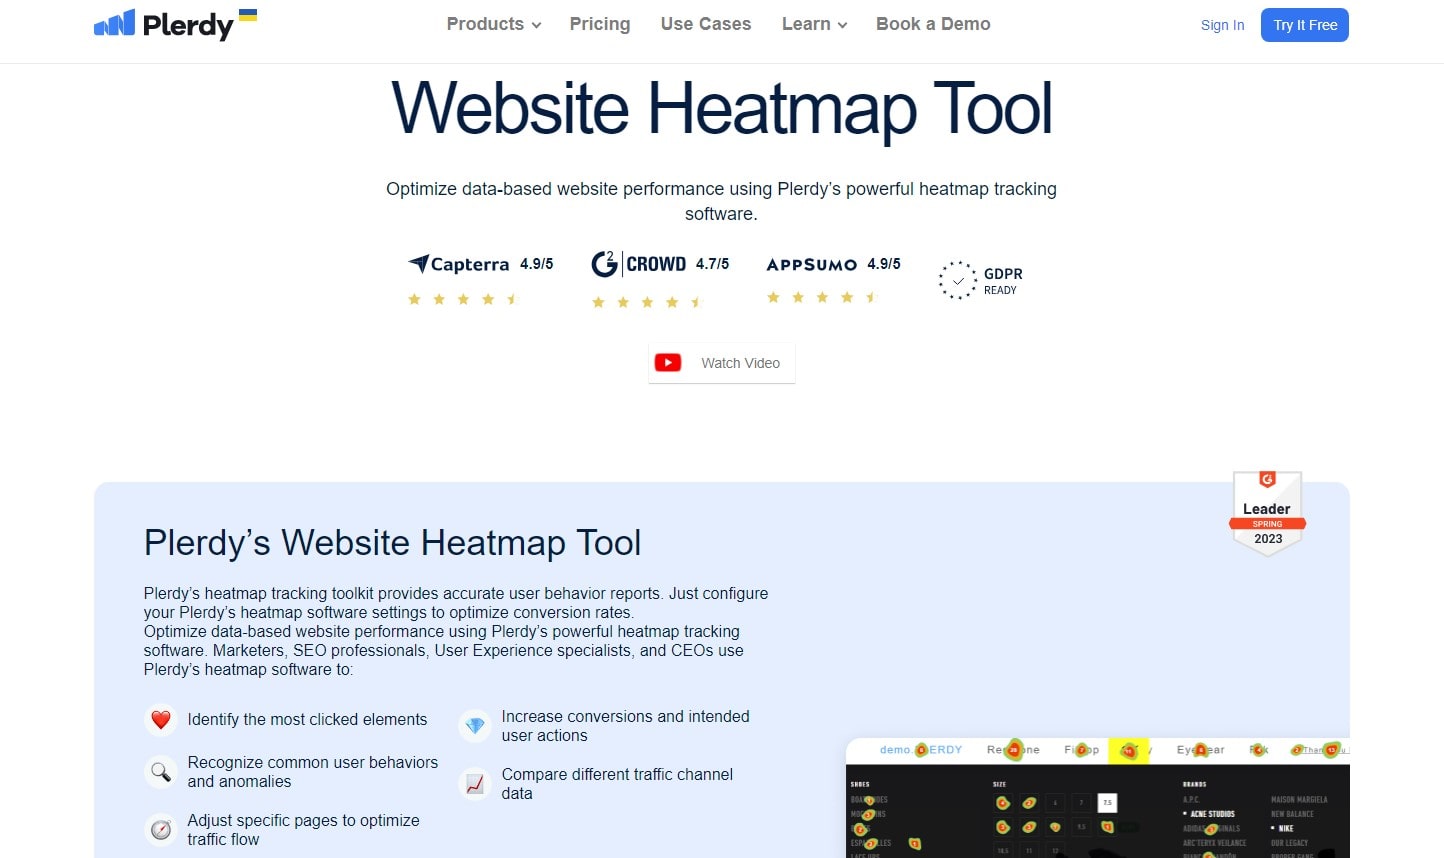
Unassuming heroes of the digital sphere are heatmaps. Remarkably effective, the Plerdy Website Heatmap Tool pulls back the veil on user involvement patterns. Heatmaps highlight hotspots of activity by picturing the degree of user interaction.
Few niches where the Plerdy heat map shines:
- E-commerce: Find which offers catch-on appeal.
- Blogs: See which pieces or categories grab readers.
- SaaS Platforms: Choose which one users find most appealing or feature-rich.
With the Plerdy heatmap, you will:
- Capture — View user interactions as explosive heat bursts.
- Navigate — The map design helps users to easily explore clicks, scrolling, and movements.
- Improve — Use the information to hone user experience and web design.
Within the busy field of digital analytics, the Plerdy Website Heatmap Tool offers priceless analysis. Using this tool can let you negotiate the terrain of your website, spot heat zones, and use that information to create an unmatched web experience. Thus, get ready to explore the heatmap analytics with Plerdy and maximize your web assets.
How Do Heatmaps Work?
Entering the complexities of heatmaps reveals a wonder of data visualization. Heatmaps create a physical image of visitor behavior by synthesizing user interactions into a rich play of colors. Heatmaps translate mouse motions, clicks, and scrolls—actions—into different heat intensities on the map. The more strong the engagement, the warmer the color, therefore providing site managers with a view of regions attracting user attention.
Unfolding the process:
- Data collecting: Users’ movements are recorded while they negotiate, providing basis for the heatmap.
- Interactions raise the heat; frequent clicks or hovers produce flaming reds; less frequent encounters fade to cooler blues.
- Heatmap smoothly overlays the original website design to provide a transparent view of user involvement zones.
- Niches of Examples: Heat could highlight hot issues or shared posts for bloggers; it could highlight best-sellers in e-commerce.
Using the synergy of heat and map, heatmaps give marketers a tool to improve their layout and content. Understanding where people gravitate and where they drift away helps companies improve their digital presence, hence improving user experiences.
Benefits of Using Website Heatmaps
Heatmaps stand out as a strong tool to raise the ante in the digital ecosystem, where user involvement is critical. They provide a different view of user behavior by turning chilly data into sizzling images. Let’s dissect the powerful advantages:
- Focus on Hot Zones: Heatmaps highlight busy locations, so enabling companies to highlight promotions or core offers.
- Finding cooler areas on the map helps businesses rethink design or content that isn’t resonating.
- Heat helps in website redesign so that important components don’t be lost sight of.
- User Behavior Interpreted: A heatmap might highlight trending items for an online publication; in digital showrooms, it might draw attention to certain objects.
Heatmaps provide the path for practical insights by merging heat and map. Heatmaps act as your lighthouse whether your focus is on user interaction, navigation simplification, or content redesign. Their capacity to see intricate data sets sets them distinct and gives them a boost in a digital environment going more and more competitive. Using this instrument can make all the difference between just existing online and flourishing vibrantly.
Enhanced User Experience (UX) design
Using heat, heatmap, and map data, contemporary designers are creating unparalleled digital experiences. These instruments provide understandable interfaces by clarifying user behaviors. Get into details:
- Heatmaps provide hints on visitor movement around a site, therefore enabling smooth flow changes.
- Heat spots indicate best placement of important elements, therefore guaranteeing they attract the user’s eye.
- Constant heatmap updates function as real-time feedback, therefore promoting continuous improvement.
UX designers may predict user demands by combining heat with map knowledge, therefore enabling memorable site visits. Heatmaps provide transforming insights that bring every pixel life, whether they are an artist’s portfolio or an e-commerce hub.
Improved Conversion Rate Optimization (CRO)
Using heat, heatmap, and map analytics, companies find regions ready for improvement. Through decoding user habits, they create methods that appeal and yield. Discover this transforming trip:
- Study of heat patterns helps one quickly identify and smooth out user barriers.
- Heatmaps help CTAs to be strategically positioned such that they maximize interaction.
- Engagement hotspots: Companies zero in high-heat areas using map data to increase interactions and drive conversions.
Heat with map intelligence creates a powerful recipe for CRO. From digital platforms to online boutiques, using heatmap insights drives businesses into a field of continuous development and high user pleasure.
Identifying Problem Areas on Web Pages
Using heat, heat map, and map tools in concert, companies highlight areas of weakness on their sites. Beyond appearance, utility rules supreme; so, identifying these flaws becomes easy:
- Heatmap data highlights areas where user engagement declines, therefore motivating redesign initiatives. Interaction voids.
- Map insights point to complex paths, therefore guiding the building of a simplified path.
- Content Dead Ends: Indicating changes, content might not resonate where heat withers.
From e-commerce to blogging, knowing heatmap analytics guarantees user friction won’t impede site goals. When knowledge of maps meets heat, possible hazards have no chance. By addressing these issues head-on, empower the success of your site.
A/B Testing Insights
Explore A/B testing deeply armed with heat, heatmap, and map tools. releasing these gold mines of information creates precisely defined avenues for optimization:
- Heatmap analysis breaks apart hot zones to reveal the more preferred version of engagement metrics.
- Tracking heat and map interfaces helps to focus on seamless navigation by pinpoints of user paths.
- Heat highlights high-impact locations, therefore clarifying the parts of actionable behavior.
Using e-commerce systems and specialist blogs, for example, allows one to access heatmap knowledge and break through user experience limitations. Let heat and map intelligence improve your A/B tests by turning hypotheses into educated, practical conclusions. With this unmatched synergy, increase your digital steps.
Best Practices for Using Heatmaps
Using heatmaps requires a calculated approach to ensure every pixel of heat and data transforms into useful insights. Best practices broken forth here will help you improve your heatmap performance:
- Before you start, establish with your heatmap what you hope to accomplish. Could you potentially simplify the user journey or maximize a landing page? Let your heatmap trip be guided by your aims.
- Select the appropriate type. Heatmaps can be click maps, scroll maps, and movement maps among other formats. Each performs a different function. While blogs may find scroll maps more useful to evaluate content engagement, e-commerce sites—for example—may gain more from click maps to examine product interest.
- Divide your data. You shouldn’t accept one-size-fits-all. Separate your heat and map data to find subtleties between many user groups or traffic sources. This method guarantees a customized analysis, so opening the path for more exact improvements.
Key Methods:
- Time Your Analysis: Particularly following major website changes or during peak traffic, examine your heat and map data during defined periods.
- Connect with other tools: Integrating with analytics tools will help your heatmap findings be supercharged. For a whole picture, match user demographics or behavior measures with correlative heat data.
- Test and iterate using your heatmap findings; don’t stop there though. Track the effect of your adjustments by continuously monitoring the heat and mapping data, therefore guaranteeing a cycle of ongoing development.
See heatmaps as your digital compass, gently and precisely guiding you throughout the maze of user activity. Unlock your website’s full potential by converting heat and map data into a gold mine of optimizing possibilities.
In conclusion
Explore the dynamic realm of heatmaps and release the possibilities of visible data. A heatmap is a useful tool for illustrating the intensity of heat values by means of color fluctuations.
In this usage, heat refers not always to temperature. It may be user activity on a website, event focus, or any metric you wish to emphasize.
Heatmaps have mostly features:
- Strong color spectrum emphasizes variations in data;
- Intuitive knowledge helps one to quickly grasp information.
- Flexible applicability ranging from geographical sites to websites.
Heatmaps help companies to better grasp customer behavior, preferences, and more. If you want to improve your CRO and UX plans, use the Plerdy tool, a trustworthy friend in visualizing important data. Convert unprocessed data into a vibrant, educational heat map and guide your initiatives with knowledge and confidence.