
Ever thought about whether the “Buy Now” button on your website more resembles a “Goodbye Now” for your visitors? Heatmaps help you to turn your guessing into a game of hot and cold. Heatmaps visualize where users click, scroll, and linger, therefore providing a behind-the-scenes view of user behavior. Here at Plerdy, we realize the power of this understanding. This post will explore how heatmaps might help you to highlight the road to an exceptional user experience (UX), thereby guaranteeing that your website is more of a magnet than a repellent. Stay around to learn the techniques using heatmaps for improving the UX of your website.
Understanding Heatmaps in UX Design
Enter the realm of heatmaps and you are like shining a flashlight on a dark room. You suddenly observe users walking, tripping, or avoiding. Explore this potent tool that improves website UX design and highlights user behavior, hence raising user satisfaction and conversion rates.
What is a Heat Map?
A heatmap is a visual aid on your website displaying activity levels using colors. Think about reds and oranges; the color is warmer the more interaction it generates. Blues and other cool colors point to less activity. This realization helps designers choose where on a webpage important components should be placed. Nielsen Norman Group offers a great basis for delving further into what heatmaps are.
The Importance of Heatmaps
Why the hubbub about heatmaps? They naturally show user behavior by slicing through the clutter of unprocessed data. Heatmaps show:
- Hotspots where most users click.
- Cold zones point to little participation.
- Scrolling patterns reveal consumers’ range of willingness to travel down.
Knowing how closely your website fits user expectations and interests depends on this information. Using adjustments grounded in heatmap analysis will greatly raise user satisfaction and conversion rates. HubSpot underlines even further the part heatmaps play in maximizing website performance.
Knowing heatmaps in UX design helps you to realize the possibilities of your website to better serve your audience, not only about where visitors click or do not click. Heatmaps let you make data-driven decisions that enhance user experience (UX) and transform frustrations into interesting interactions. Recall that a well-optimized website is a great instrument for reaching your company objectives, not only more pleasant for your visitors. With the correct heatmap analysis, your website will be both functional and irresistible.
Exploring Heatmap Varieties and Their Contributions to UX on Websites
It would seem like a superpower to explore the thoughts and discriminating precisely what fascinates and does not appeal on website users. Still, this skill is well within reach with careful application of several heatmap technologies. Every kind of heat map reveals different facets of user interactions, therefore providing a rich tapestry of insights to improve the UX of a website. Let’s negotiate the several heat map classifications and their helpful functions in improving web user experience.
Click Heatmaps and Website UX Optimization
Click heatmaps visually show interactive hotspots by illuminating user click patterns over your page. For many reasons, these realizations are essential and will help you:
- Arrangement of CTAs should increase conversion rates deliberately.
- Emphasize aspects that fall short of engaging, pointing out a need for redesign.
- Customize web navigation to enhance UX generally.
Examining click heatmaps provides the information you need to maximize every clickable element on your website, thereby ensuring that its interactive components play their intended purposes.
Scroll Heatmaps: Enhancing Engagement and UX
Scroll heatmaps display how far users scroll on your web pages, therefore indicating the degree of user involvement. This clarity is essential for:
- Matching user involvement with content length.
- Finding the “fold” to maximize content placement.
- Making sure CTAs and essential data grab the user’s attention.
Using scroll heatmap data guarantees that the content of your website is organized to efficiently grab and hold user attention, thereby optimizing UX by matching with natural user behavior.
Mouse Movement Heatmaps: A Proxy for User Attention
Mouse movement heatmaps capture cursor movement across the page as an indirect indication of user focus, however their interpretation calls for subtlety. These heatmaps can provide hints including:
- Possible central spots drawing in or holding user interest.
- Areas of uncertainty possibly compromising user experience.
- Design changes modeled by real user behavior help to simplify UX.
Although very helpful, for a complete awareness of user intent it is imperative to augment mouse movement heatmap data with other analytics.
Click, scroll, and mouse movement heatmaps help you to get a holistic picture of user interaction with your website. This helps you to make evidence-based design decisions that immediately improve UX, therefore guaranteeing your website attracts people in and offers an interesting and easy-to-use interface that motivates return visits. Heatmaps are: tools for improving website UX in the search of excellence.
- Not only tools but also necessary friends.
- Helping you develop a user-centric design philosophy that values and reacts to user demands and activities.
- Thus, on your website, driving engagement as well as conversion rates.
Plerdy Website Heatmap Tool
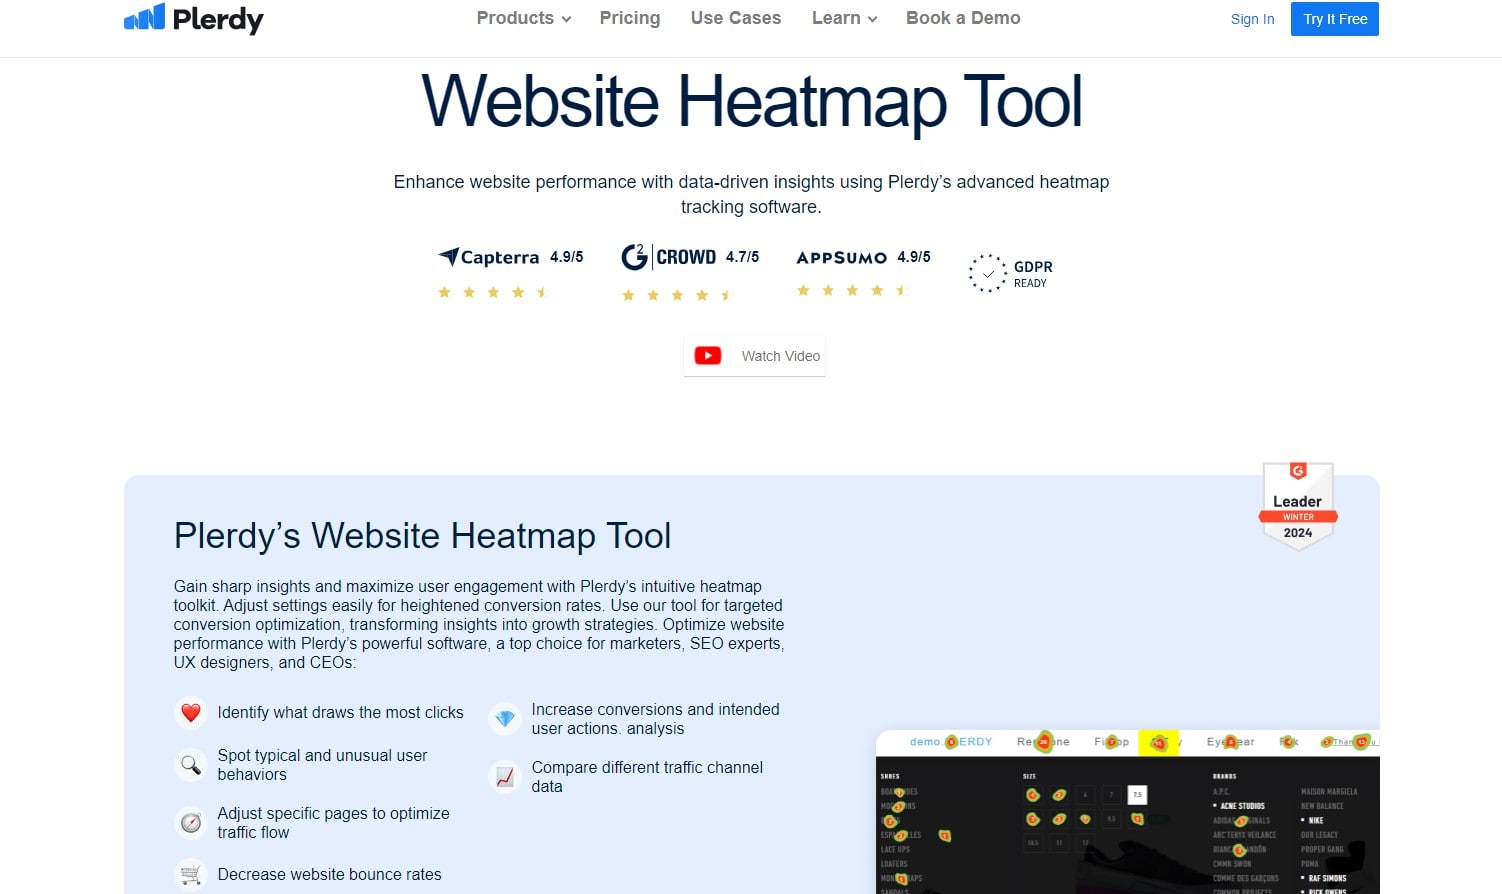
Precision tools can make all the difference when improving user experience. The Plerdy Website Heatmap Tool offers clear, practical information on user interaction with your website, therefore improving your UX approach.
Particulars of Plerdy’s Heatmap Tool Plerdy’s product is notable for its easy UI and thorough tracking features. It provides:
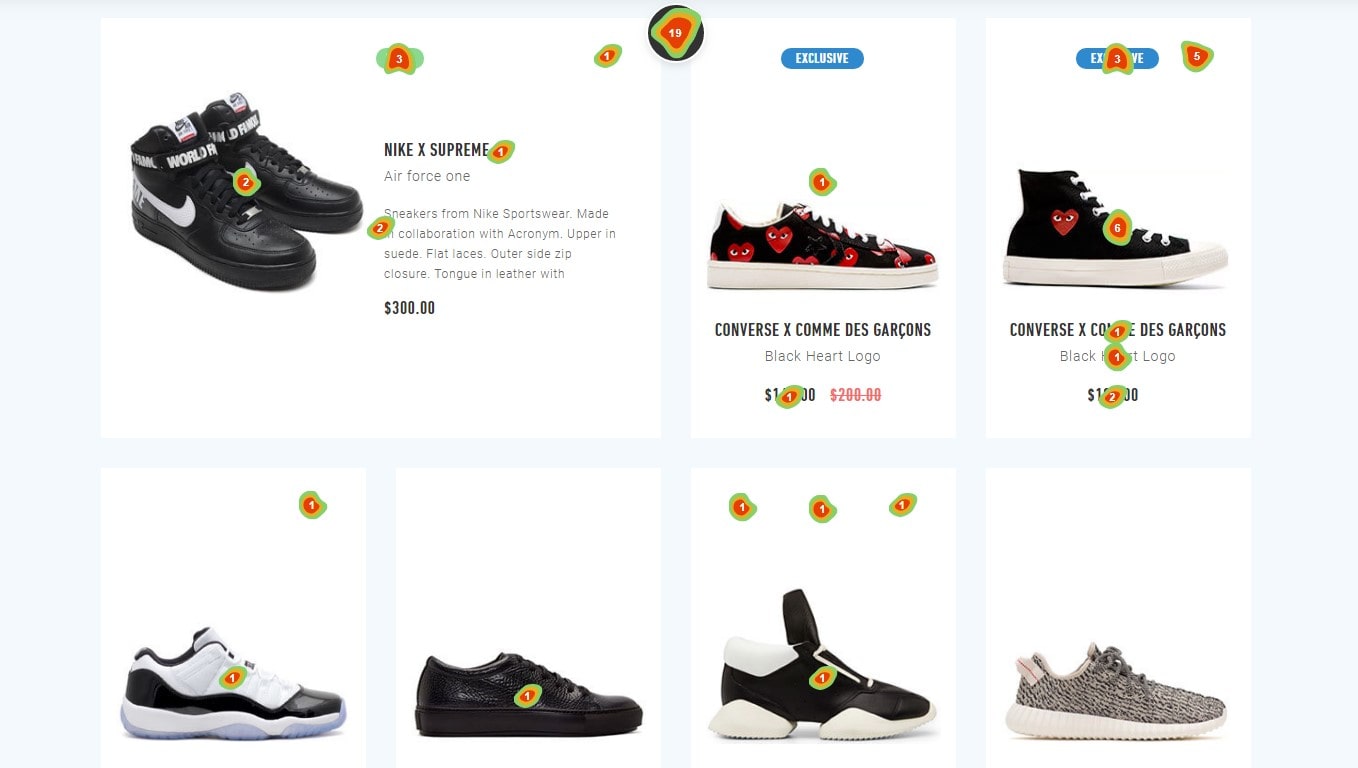
- Click Heatmaps indicate where visitors click on your website, helping you to know what grabs their attention or causes confusion.
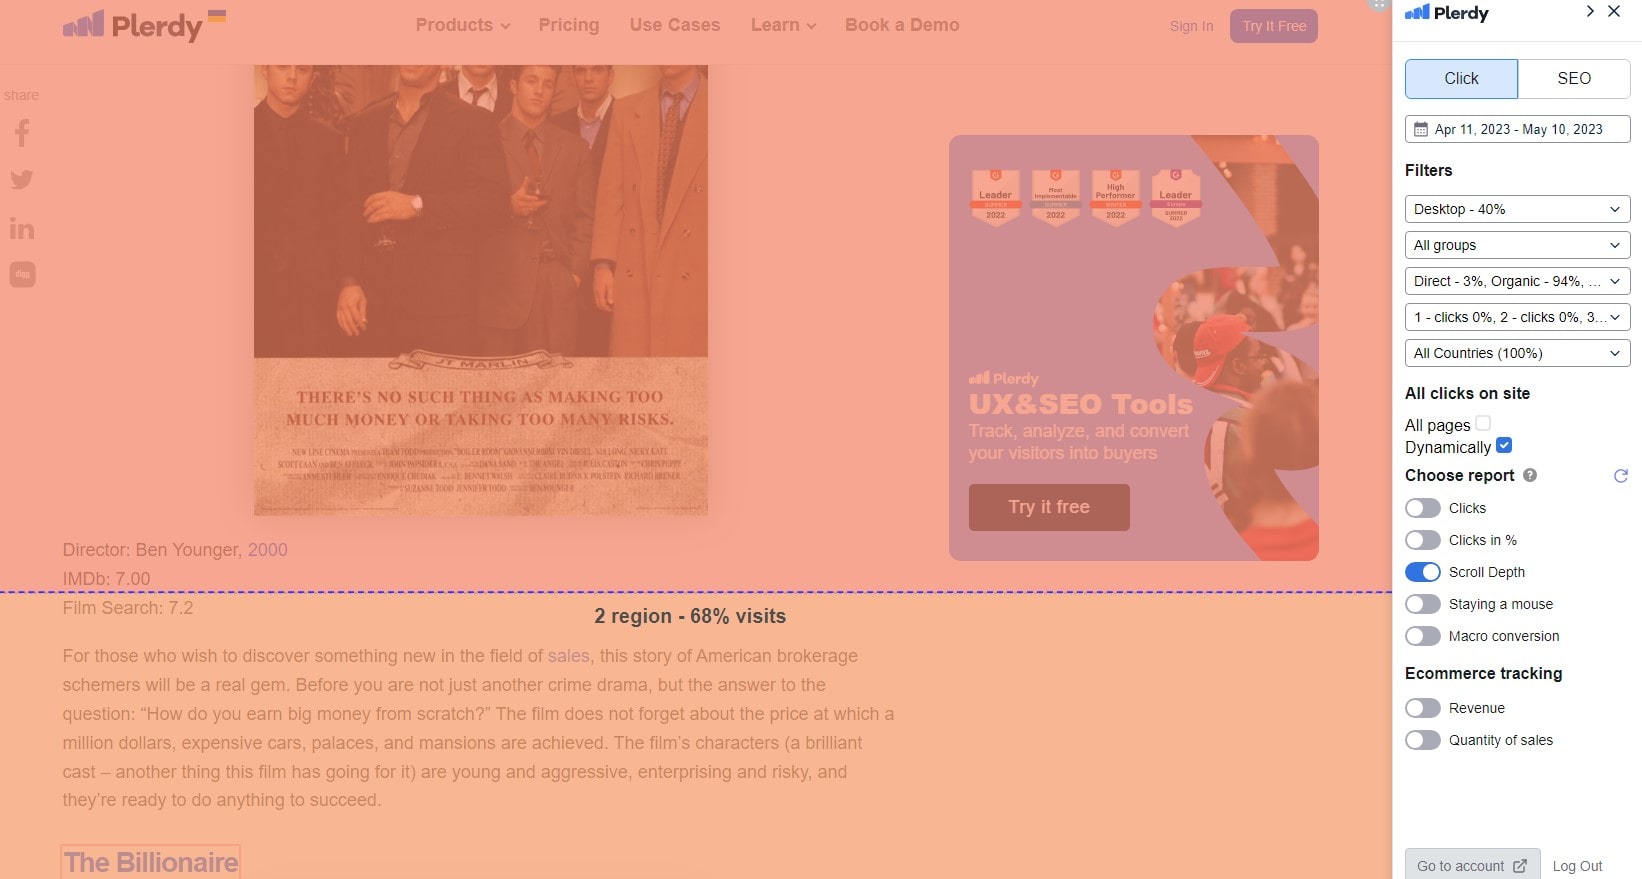
- This function tracks users’ depth of scrolling on your sites, so enabling the identification of the longest most people stop engaged for.
- Through tracking of cursor movements, Peredy offers insights on user attention areas and navigation behaviors.
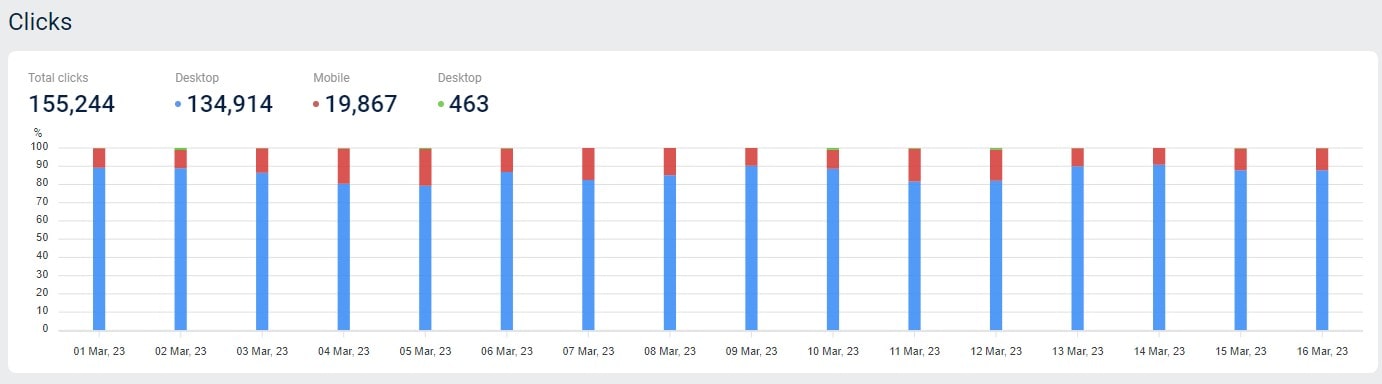
- Real-time analytics let you instantly see changes made to your website by means of data collecting enabled by Plerdy.
- Customize data views by filtering based on device kind, operating system, or user demographics to better grasp several audience habits.
These specific tools help you to rapidly and precisely make decisions based on facts.
Using Plerdy’s Insights to Improve UX Design Plerdy’s heatmap tool lets you:
- Use click and scroll data to locate important material in regions that ensure highest user involvement.
- See how users of your site navigate to find navigational errors and then maximize paths to important data.
- Change to fit user preferences.Customize your website’s layout depending on the several behaviors seen in several user groups.
Using the Plerdy Website Heatmap Tool provides a strong way to improve the user experience depending on accurate user behavior based on strong proof of user activity. Every modification you do with this tool is guided by direct user interactions, so ensuring that your website grabs and holds user interest. For further ideas on successful UX tactics, think about looking at extensive materials such Nielsen Norman Group.
Conducting Effective Heatmap Analysis
Unlocking the secrets of user engagement on your website requires not just knowledge of the appropriate technologies but also efficient application of them. A lighthouse amid the muddy seas of UX improvement, heatmap analysis helps us to navigate to make wise decisions. Let’s explore the approach that guarantees your heatmap study is a road map for significant UX enhancements rather than as a data collecting tool.
Setting Up Your Heatmap Study
Starting a heatmap study begins with accuracy and clarity. Choose a heatmap tool based on your goals—click patterns, scroll depth, mouse movements, or another whole different approach. Tools like Hotjar or Crazy Egg have complete capabilities fit for many types of research. Make sure the heatmap monitoring code targets pages important to your user’s journey or where you suspect UX problems is smoothly integrated across your website.
Analyzing Heatmap Data
Deciphering the narrative behind the colors is the essence of heatmap analysis. Start with clicking heat maps; find the cold zones and hotspots. While cold zones may highlight missed chances or design aspects that are not interesting as planned, hotspots can validate your design intuition and show you what is working.
Scroll maps tell whether important information should be seen depending on its location or whether your pages are too long, which would cause user drop-off. They also take you deeper Content strategy depends much on this realization, which helps you reinterpret important messages inside the user’s perspective.
Finally, mouse movement heatmaps—though less obvious in their implications—can show regions where users stop, maybe suggesting curiosity or uncertainty. This information can help you to simplify navigation paths on your site and improve content placement.
Implementing UX Improvements
Your heatmap study’s insights are only as worthwhile as the actions they encourage. Start with the low-hanging fruits—straightforward changes most likely to affect user experience right away. This could involve moving important CTAs into hotter areas, cutting down too long pages, or reassigning design elements that regularly fail to interact users.
For more complicated results, think about using A/B testing several solutions to make sure the modifications you apply improve the UX. Using heatmap data and other UX measures, track performance both pre- and post-adjustment to find more areas for optimization.
Good heat map analysis is an ongoing learning, adjusting, and measuring process rather than a one-time chore. Transposing data into practical UX improvements calls both analytical rigor and creative problem-solving. We want to offer a flawless, interesting user interface beyond expectations. Applying the knowledge from your heatmap analysis carefully can help you to make sure your website develops in line with the needs of your users, therefore promoting loyalty and satisfaction.
Real-world Implications of Heatmap Analysis for Enhancing UX
In the broad digital sphere, heatmap analysis reveals often small but significant insights that help to differentiate a decent user experience (UX) from a great one. The deliberate application of heatmap analysis in practical situations has transformed the dynamics of corporate-consumer contacts on the web. Examining how these dynamic data representations inspire significant changes, we emphasize the essential part heatmap analysis performs in improving website user experience.
Case Studies Highlighting the Impact of Heatmap Analysis
Using click heatmap data, an e-commerce company found a trend whereby many users tried to interact with product photos as if they were hyperlinks to thorough descriptions. Turning these images into clickable links produced an amazing 20% increase in views of product detail pages, therefore greatly increasing conversion rates. This approach demonstrated how heatmaps may enhance online shopping user experience.
Content Engagement Through UX Insights: A widely read blog found a decline in reader engagement outside of the midpoint of its posts by means of scroll heatmap analysis. Early in the material, this heat map research led to a strategic placement of important summaries and calls to action that earlier on in the content, thereby increasing reader involvement and subscriptions. This scenario shows how effectively heatmap analysis may improve content strategy to increase website UX and interaction.
Using mouse movement heat map analysis, a Software as a Service (SaaS) vendor found user engagement in a non-interactive website portion. Heatmap analysis shows that adding a dropdown menu in this hotspot greatly improved the navigation experience—as seen by a 30% decrease in the bounce rate. This example shows how heatmap study could find chances to improve the UX of website navigation.
Unmatched in its transforming ability to meet and predict consumer wants and behaviors is heatmap analysis It goes into the nuances of user interactions to guide strategic decisions, transcending basic observation. In these practical situations, the use of heatmap analysis clearly shows its effectiveness in identifying UX issues and pointing up areas for improvement and development. Data turned into meaningful insights helps companies create a more successful, understandable digital presence. The core of great UX design is constant attunement to user feedback; heatmap analysis offers a dynamic and colorful path for reaching this and is therefore a vital instrument in the toolkit of website UX optimization techniques.
Leveraging Heatmap Insights for Enhanced UX Through A/B Testing
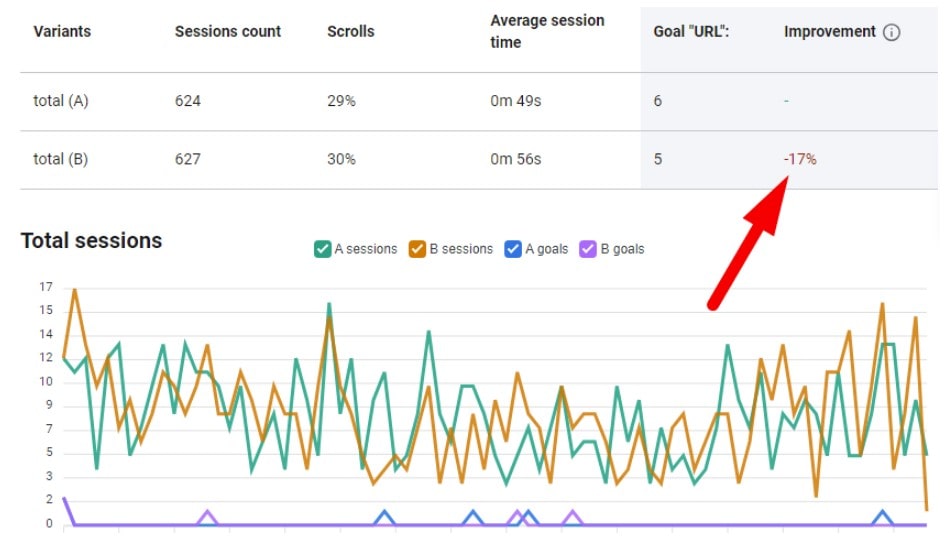
Deciphering the complexity of user behavior on your website depends on using the rich data shown by heatmaps. This thorough exploration of UX ideas prepares the ground for the next crucial stage: A/B testing validation of these discoveries. This methodical approach sets two homepage variations against one another to find which one maximizes conversion rates and user involvement. Including heatmap insights into A/B testing increases its ability to greatly improve website UX.
Heatmap analysis first helps you identify particular areas on your website that can use improvement. Heatmap data, for instance, will show this deficiency should a Call-To- Action (CTA) button receive less attention than intended. Equipped with this knowledge, you can create two variants of the webpage: one keeps the original layout and the other shows a more clearly positioned CTA derived from heatmap analysis.
Monitoring the conversion rates of every webpage variant and exploring user engagement measures that heatmaps deftly track—such as click behavior and scroll depth—as the A/B testing advances is essential. Examining these measures over several homepage versions clarifies the subtle effects of changes motivated by heatmap data on user interaction patterns.
Good A/B testing is hypothesizing, testing, evaluating, and iteratively improving. A navigational aid on this road, heatmap insights guarantee that every iteration is supported by strong data regarding user preferences and behaviors.
Using this synergistic method will help you to go beyond the field of choices in speculative design. It helps your website to develop in a way that truly fits user wants and preferences, hence improving UX and increasing the conversion rates. In this regard, combining heatmap insights with A/B testing becomes a powerful approach to improve website UX, thereby ensuring that judgments are informed guesses and data-driven actions that really appeal to your audience.
Leveraging Heatmaps for Mobile UX Optimization

In a time when mobile devices rule online use, mobile-optimized websites are absolutely essential. Heatmaps provide a different prism through which one may view and enhance the mobile user experience (UX). It can display how different mobile users interact with your website from desktop ones, thereby allowing optimization.
Mobile heatmaps can expose user behavior unique to touchscreens including zoom interactions, tap patterns, and scroll depth. Mobile users often try to touch non-interactive components, for example, suggesting a possibility to improve navigational signals or make some aspects clickable.
For mobile UX especially, scroll heatmaps can also be quite revealing. Mobile users’ smaller screens let them scroll more than those on PCs. Finding the scroll depth at which most users drop off will help you arrange material and place important information and CTAs so that they are viewed before the user leaves.
Still additional consideration are changes in mobile layout and design. Heatmaps could show that some design features seem great on desktops but confuse or irritate mobile users. This could be the result of smaller touch targets or writing on smaller screens that is difficult to see. By applying these ideas, you can design specifically for mobile devices that fits the subtleties of mobile interaction, therefore improving general usability and happiness.
Heatmaps tailored for mobile devices will enable you to make sure your website suits users’ demands and behaviors and looks amazing on mobile devices. By greatly improving engagement, lowering bounce rates, and raising conversions, this focused approach to mobile UX optimization will help your website to be a favored destination for mobile consumers.
In conclusion
Not merely to follow a trend, heatmaps seek to enhance the capacity of your website to satisfy users’ needs. As we have shown, the deliberate use of heatmaps may greatly improve the UX and direct your design choices with the clarity of user behavior insights. Still, the road is long. The digital terrain is always changing, thus are the approaches to include and please your audience. Seeking more ideas and tactics? Explore the Plerdy blog further, one article at a time, breaking the riddles of digital user experience. All set to apply knowledge gained? Find out how Plerdy might transform the UX of your current website right now.