
Both the bounce rate and the exit rate are metrics from the Google Analytics dashboard, but how do you distinguish between the two? ?
The bounce rate shows the number of visitors who land on your website and leave immediately. Meanwhile, the exit rate shows the number of visitors leaving your website from a page they didn’t land on.
With this minute difference, it’s easy to confuse the bounce and exit rates. All bounces are exits, but not all exits are bounces.
So, how do these marketing metrics differ? Let’s find out. ?

Bounce Rate
To understand what a bounce rate is, imagine this scenario:
You want to do an SEO audit. Your first instinct is to head to Google for an SEO audit template. You cherry-pick and click on your favorite results for the first few results, then land on a specific web page.
You may leave immediately without doing anything else on the webpage because you don’t like what you see. You may return to your search results, visit another webpage, or close your browser.
Alternatively, you may read the blog post and leave. Or enter a different search term in the search bar.
These actions mean you’ve bounced from the page after one session.
To calculate the bounce rate, divide the total number of sessions on a single webpage by the total number of website visits. To view your bounce rate inside Google Analytics, head to Behavior, click on Site Content, then click on All Pages.
Generally, an ideal bounce rate ranges from 26-40%, and a fair bounce rate ranges from 41-50%. Anything above 50% and above 80-90% deserves attention.
However, bounce rate metrics vary from industry to industry. Here’s a breakdown of bounce rate benchmarks by industry:
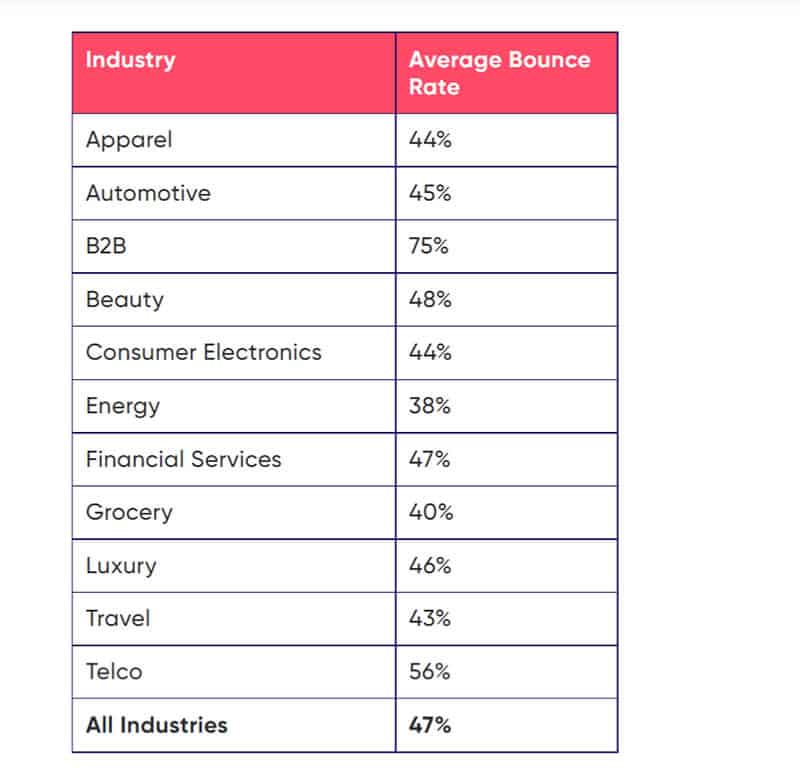
The average bounce rate for all industries in the benchmark report is 47%, which is ideal.
In B2B, the average bounce rate is 75%, which may or may not be a concern depending on factors such as:
- Whether the content of a webpage meets user intent
- Whether the offer and copy resonate with the web visitor
- Whether the website is getting qualified traffic
When evaluating a bounce rate, the idea is to have a balanced view. Understand that it reflects the quality of website visitors’ experience.
Continually work towards improving your website to deliver a better user experience.
Exit Rate
Let’s return to our scenario above, where you want to do an SEO audit.
Assume you clicked on any results, read the content, and moved around the website to learn more. You may have chosen to visit the product page and check the pricing.
Alternatively, you may have clicked on a link leading you to a page where you can sign up for a demo. That is an exit, and it is also expressed as a percentage. To calculate your exit rate, count the total number of exits from a given web page and divide that by the total number of visits to that page.
To find your exit rate inside Google Analytics, click on Visit Behavior, Site Content, and All Pages to see the exit rate for each page.
Your exit rate tells how effectively your pages get web visitors to take action.
If you have a high exit rate and visitors aren’t completing the micro-conversion goals you’ve set, you need to identify ways to improve your conversion rate.
For example, if a visitor lands on your homepage, visits your product catalog, heads over to a product page and then leaves without completing a goal, such as adding items to their cart, investigate further to understand their behavior on the page.
To view their actions on your web pages, use a heatmap and record sessions to study how visitors interact with the pages they exit. These tools show how they behave on these pages and offer insight into what you need to do to improve conversions.
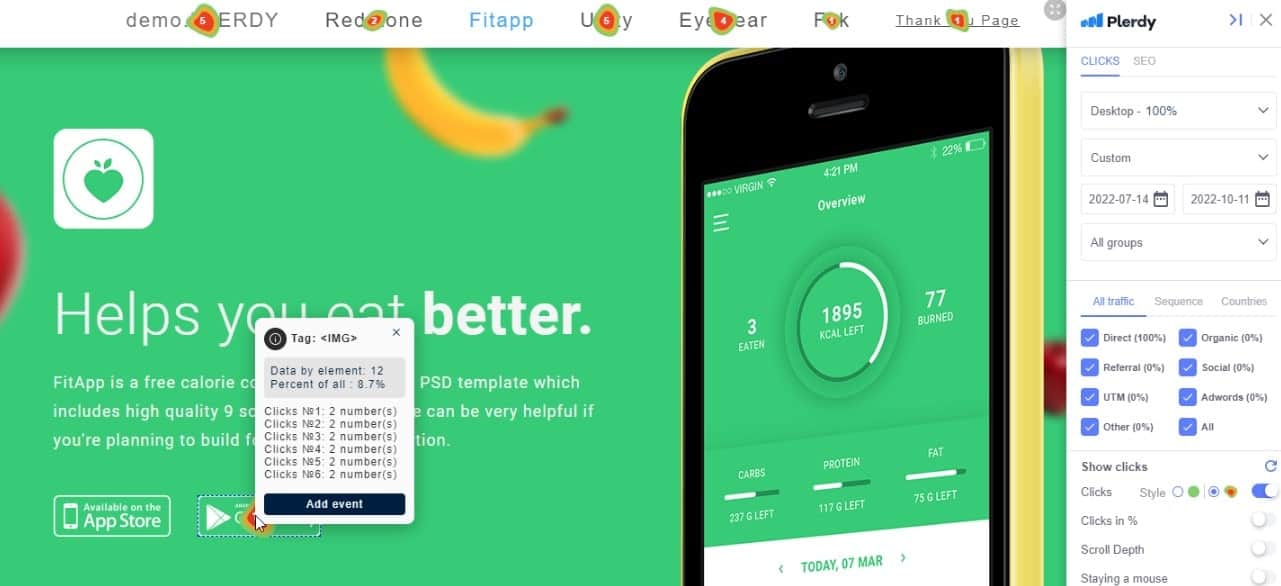
For example, heatmaps may help you dive deeper into user research, where you can segment the data by traffic channels. This shows how visitors from different channels behave on the page.
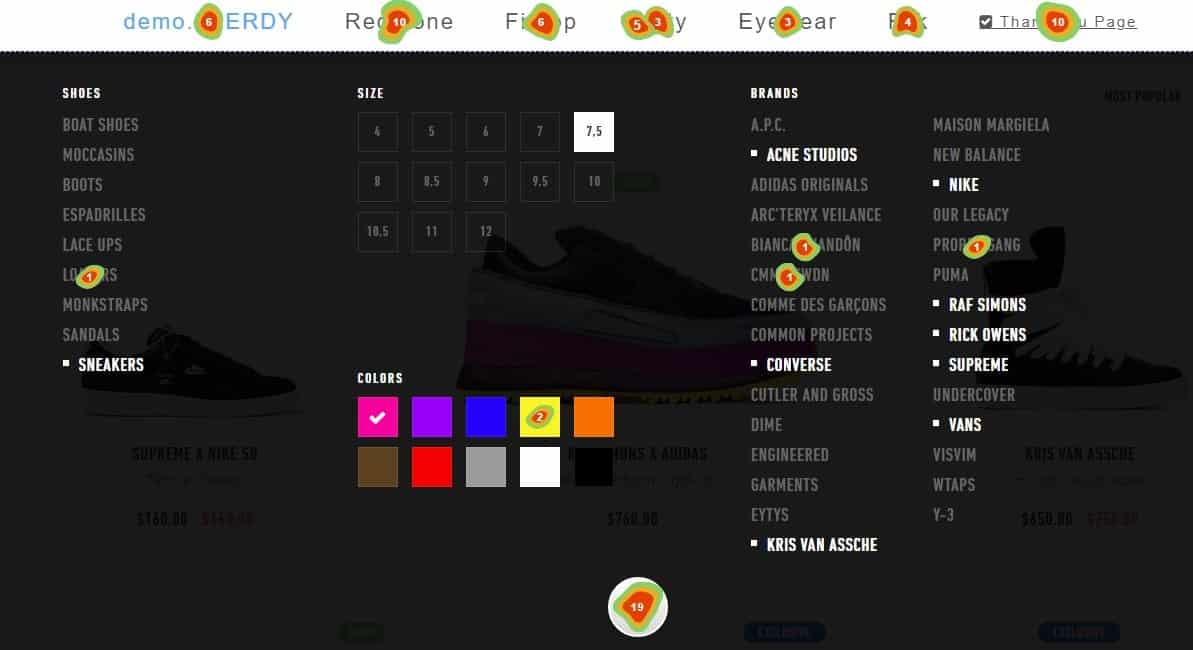
You also see how deep web visitors scroll on different pages to inform when to trigger the pop-up before they exit the page.
Heatmaps also point you to the navigation elements your web visitors click on. They help you reorganize them by removing clutter or placing the more important elements where they click often.
That said, your conversion rate varies depending on the industry. Here are the industry benchmarks for a good conversion rate:
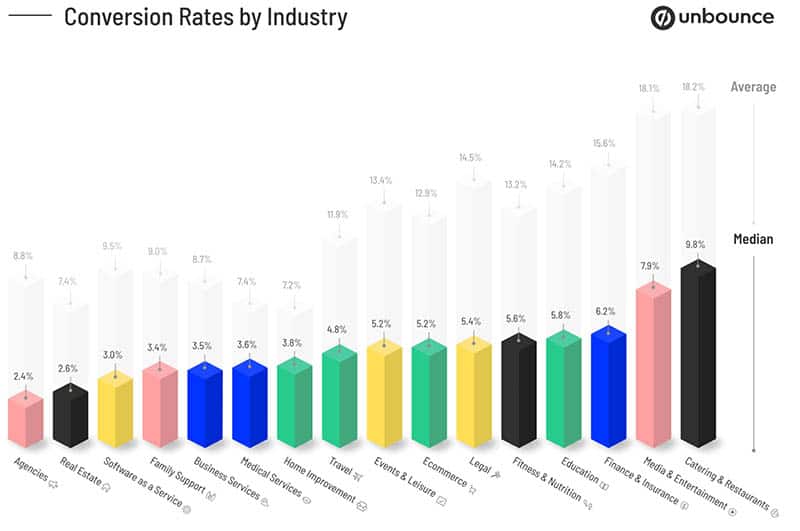
These conversion rates vary based on the amount of money spent per purchase. They also vary depending on the length of the sales cycle. In the software industry, the median conversion rate is 3.0%.
The B2B buying journey takes time and involves different stakeholders, but the amount of money spent per purchase is significant. It evens out eventually.
On the other hand, you’ll see a higher median conversion rate of 5.2% in eCommerce. We can attribute this to shorter sales cycles.
Compared to the software industry, eCommerce shoppers spend less money per purchase. The seasonal nature of eCommerce means that sales increase during specific events during the year when customers get a discount.
Avoid looking at your exit rate in isolation without describing the conversion goals you set on specific web pages. Compare that to industry benchmarks, see how you’re faring and identify ways to improve.
How to Reduce your Website’s Bounce Rate
We’ve already seen that a bounce rate points to user experience issues. Just like an exit rate, don’t evaluate it in isolation. You may lack sufficient context on what to do to improve it.
Look at dwell time (the time visitors spend on a webpage) to see how long visitors stay on your website before they bounce.
If you have a high bounce rate and a low dwell time, here’s what you need to do to reduce your bounce rate and, consequently, increase dwell time:
Improve User Experience
Once visitors click on a link leading to your website, they expect it to load in 1-2 seconds.
If your website takes longer than that, you can’t count on them to stay around. Use the page speed insights tool to test load speed and work with a developer who will help you address issues related to your page speed.
If your website loads fast enough and web visitors land on your homepage, the first thing they see is the layout of the elements on your page. Is your navigation easy to find? Do you have pop-ups that interrupt them every few seconds?
If so, get rid of the clutter. Remove unnecessary pop-ups and use design elements that resonate with your website visitors.
Alternatively, schedule pop-ups to show after the visitor spends some time interacting with your web page. Use quick links with relevant descriptions to help visitors move around your website to find what they need.
Improve Your Content
If your content isn’t what visitors want, they will leave. Optimize content to match your visitor’s intent. Ensure it answers their questions and provides relevant solutions to their problems.
If you target low-volume keywords to create bottom-of-the-funnel content, then you want to make sure that you address pain points, overcome objections, and optimize titles to help readers know that this is for them.
In addition, make sure that offers on each webpage match the buying stage of website visitors.
Instead of active pop-ups on your site asking web visitors to sign up for a demo on a piece of informational content, use internal links inside the content and a sidebar to help visitors dig deeper and consume content.
In addition, consider running A/B tests for different offers on your landing pages to see which resonates better with customers.
Refine Your Target Audience
To drive the right kind of traffic to your website, refine your ideal customer profile and update your messaging to make your copy resonate better.
Consider segmenting your audience and ensure your web copy caters to each segment. Then, get backlinks from relevant websites and disavow links that bring you irrelevant traffic.
Having a high bounce rate on your website can be detrimental to the success of your content marketing efforts. A high bounce rate means your web visitors are not engaged with your content and may even be turning away from it before they can dig deeper and find what they’re looking for.
Using the methods we’ve discussed above will reduce your website’s bounce rate, improve user experience, and ensure visitors spend more time on your website.
Conclusion about the Difference Between Bounce Rate vs. Exit Rate
Both bounce rate and exit rate show how your website is performing. ?
When looking at both metrics, you’ll want to see how they’re connected to key performance indicators ?, such as lead generation and conversion rates, instead of evaluating them in isolation.
If you want to track how users interact with your website, use Plerdy to track user experience and collect comprehensive data to help inform your strategy and improve your overall website performance. ⚡?
Bounce rate measures visitors who leave the website after visiting a single page. A high bounce rate indicates that your website may not be providing the information or experience the visitors are looking for or that the content on your landing page is not relevant or compelling. On the contrary, a low bounce rate can indicate that visitors find what they’re looking for and engage with your website.
Exit rate, on the other hand, is the measure of visitors who leave the website after visiting two or more pages. A high exit rate can indicate that visitors are losing interest in your website or finding it difficult to navigate. In contrast, a low exit rate can mean that visitors find what they’re looking for and engage with your website.