
User engagement metrics help understand the customer experience by measuring behavior indicators. It is a sort of psychological analysis of website visitors based on data. The metrics act as indicators of user experience on your eCommerce website.
The insights gained from the metrics apply to several aspects of user experience, from the first visit through a marketing channel to delivery through micro-fulfillment. Based on the metrics, you can decide whether the user experience yields desired results ⚡ or need improvement ?.
7 Important User Engagement Metrics for eCommerce
Below are user engagement metrics to help you understand what people are doing on your eCommerce website and what UX factors drive those behaviors.

Bounce Rate
This metric shows how many people came to your eCommerce website and left without taking any significant action. The average bounce rate for eCommerce websites is 47%. This metric shows many things, including user engagement and traffic quality.
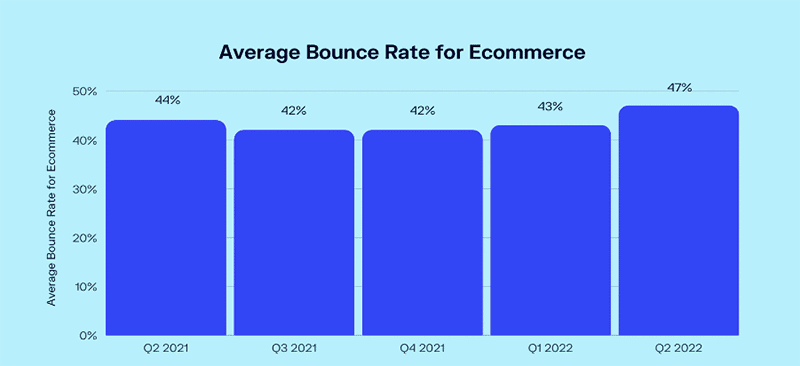
A high bounce rate usually results from UX issues such as long loading times, poor interface, unappealing design, website errors, etc. You can track this metric for different landing pages on the website to identify common user engagement issues. You should also track it after making improvements to measure the result.
A high bounce rate can also result from poor audience targeting. If your marketing campaigns bring in irrelevant visitors, they will likely leave the website without taking action. You can check the bounce rate of different traffic sources to identify the audience quality from each.
Average Session Duration
This metric tells you how much time a visitor spends on your eCommerce website. The average session duration for eCommerce visitors is 2 minutes and 3 seconds. It is an important indicator of user engagement on the website. Visitors stay longer on eCommerce websites with relevant products and appealing UX.
Average session duration is connected to several aspects of user experience. These include information architecture, navigation, product display, interactive features, etc. If users spend more time on your website, they are positive about their experience.
You can measure this metric for different pages on your eCommerce website. You need to make UX improvements if any pages have a low session duration. You should pay special attention to the average session duration for product pages. It will help you understand how much information a visitor consumes before purchasing or abandoning it.
Average Page Views per Visit
This metric shows how many pages an average user visits before leaving your website. It is an indicator of user engagement, traffic quality and UX. The eCommerce industry average for this metric is 6.5 pages per visit.
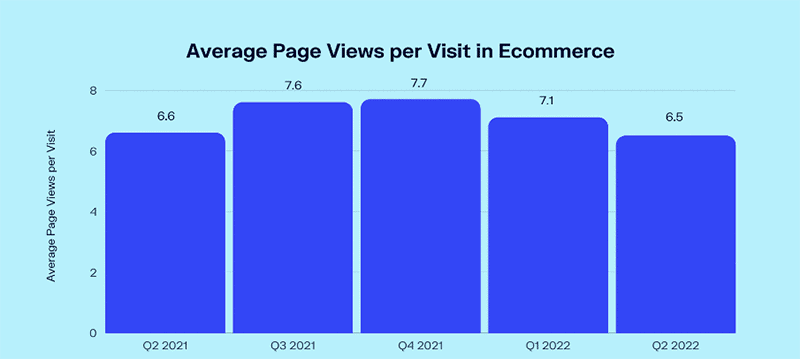
The average page views per visit metric tell a lot about user engagement. First, it shows that the website has made a good first impression. Second, it shows that the visitors found relevant or interesting things on the landing page, encouraging them to explore more. And third, it indicates the likelihood of conversion.
You can further understand the user engagement on individual pages by studying a heatmap. The heatmap shows what people are doing on different pages. Using heatmaps alongside average page views per visit will help you understand user engagement and the customers’ purchase journey.
These two metrics can help you understand user engagement and the customers’ purchase journey.
Click-Through Rate (CTR)
When a customer is interested in something, they reward it with a click. A click-through rate is a ratio between impressions and clicks. Although CTR measures the effectiveness of advertisement campaigns, it can also tell much about user engagement.
Click-Through Rate = (Number of Clicks / Number of Impressions) * 100
You only need to replace impressions with visitors to measure user engagement on your eCommerce website. This way, you can compare CTR for different call-to-action buttons to see which gets the best user engagement. This metric is the measure of audience interest. You can measure CTR for different pages on your website to analyze user engagement for each of them.
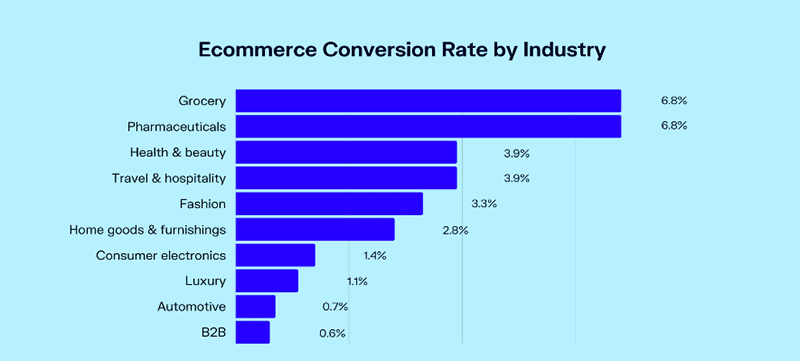
Conversion Rate
Conversion rate measures the ratio at which your visitors convert into customers. It is one of the most important metrics to measure user engagement for eCommerce websites. Different eCommerce product categories have different conversion rates.
Conversion Rate = (Total Number of Orders / Total Number of Visitors) * 100
The conversion rate is usually measured based on a period. For instance, you got 1,000 visitors to your website in December 2022. Out of these visitors, 40 people bought something. Then your conversion rate for December 2022 is 4%. This way, you can calculate conversion rates for different periods.
It is also a very useful metric for UX A/B testing. You can compare the user experience of different product pages by comparing their conversion rates. The page with a higher conversion rate indicates a better user experience. You can also use this formula to calculate the conversion rates of different marketing campaigns and landing pages.
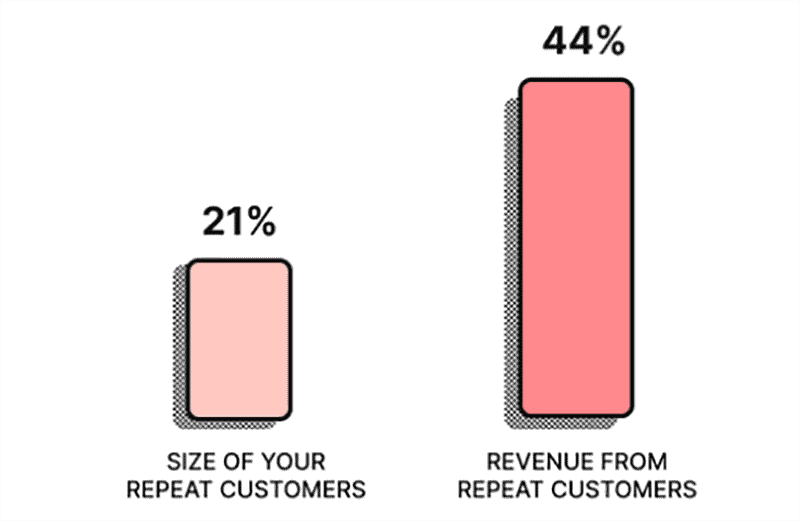
Customer Retention Rate
What could be a better indicator of a great user experience than a repeat customer? Customer retention rate is the percentage of repeat customers you get for a particular period.
Customer Retention Rate = ((Number of Customers at the End of a Period – Number of New Customers) / Number of Customers at the Beginning of a Period))* 100
Let’s say you get a 15% customer retention rate for this month. It means that out of every 100 customers, 15 are likely to purchase from you again. A high customer retention rate is crucial for eCommerce businesses as it is directly proportional to revenue.
A high customer retention rate is a positive indicator for many things, including user experience, product relevance, audience quality, and more. A high retention rate shows that almost everything from user engagement to micro-fulfillment went right.
Cart Abandonment Rate
A high cart abandonment rate is one of the biggest indicators of an unpleasant user experience. The cart abandonment rate shows the percentage of people who created a cart but did not go through with the payment.
Cart Abandonment Rate = (1 – (Number of Purchases / Number of Carts Created)) * 100
The eCommerce industry usually has a high cart abandonment rate. The global average for cart abandonment is 71.68%. People give up purchases due to several reasons, one of which is bad user experience. Hindrances related to the check-out process account for two of the top five cart abandonment issues.
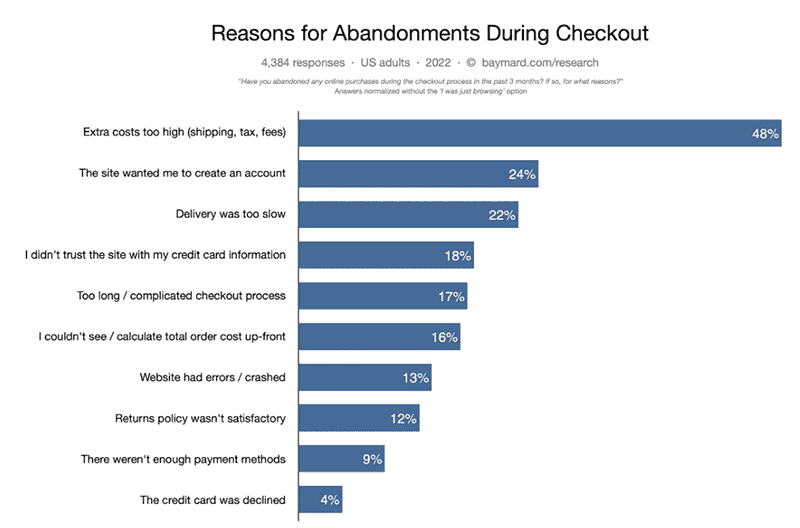
If you can reduce the cart abandonment rate, you can increase the number of orders and the number of customers. You need to simplify the user experience during check-out to reduce the number of abandoned carts.
People usually turn away from purchases if you ask them to create an account or don’t have a simple and clear check-out process. If you improve the user experience, you could retain those customers.
These 7 user engagement metrics will help you understand which aspects of your website create a positive user experience for your customers. You can use a smart eCommerce analytics tool to get accurate insights.
Conclusion
While each of the above user engagement metrics provides much information, you can gain even more insight if you understand how these measurements affect each other and the overall user experience. Such an understanding will help you narrow down problems in user engagement. It will also help you identify the best-performing aspects of your website.
You also need to keep a consistent record of these metrics to understand how your user behavior changes with time and correlates to updates on your website. So keep calm and keep measuring! ?