

Website monitoring tools continuously check whether a site is available, fast, functional, and safe for visitors. The right platform warns a team before downtime, an expired SSL certificate, a failed checkout, a slow page, or a browser error becomes a revenue problem. The wrong setup produces plenty of alerts without showing which issue actually affects customers.
Plerdy covers the real-user and business-impact side of website monitoring. It automatically captures JavaScript, AJAX, 404 resource, 5xx, and unhandled promise errors and connects them with affected sessions, pages, devices, browsers, and the visitor’s last action. Plerdy is not a synthetic uptime checker, so most businesses should pair it with an external availability monitor. That combination reveals both whether the website is reachable and what breaks after a real visitor opens it.
Quick Answer: UptimeRobot is the easiest starting point for basic uptime checks, Site24x7 is the strongest all-in-one option, Pingdom combines established availability and performance monitoring, Better Stack is excellent for monitoring plus incident response, Checkly fits developer-led synthetic testing, Datadog and New Relic serve complex application stacks, and Plerdy is best for connecting real-user website errors with conversion and behavioral context.
What Are Website Monitoring Tools?
Website monitoring tools test a website or web application at scheduled intervals, collect telemetry from real users, or do both. They detect availability failures, slow responses, broken transactions, certificate problems, DNS issues, frontend errors, and other conditions that can prevent visitors from completing a task.
A website monitoring service normally works from outside the website. Monitoring locations request a page, API, DNS record, or scripted transaction and verify the response. Real user monitoring works inside the visitor’s browser and measures the experience that actually occurred. Error tracking captures failures in browser or application code. These methods answer different questions and are most useful together.
Six Types Of Website Monitoring
- Uptime Monitoring: Requests a URL or service regularly and alerts when it becomes unavailable or returns an unexpected status.
- Synthetic Transaction Monitoring: Runs scripted journeys such as signing in, searching, adding a product to the cart, or completing checkout.
- Website Performance Monitoring: Measures response time, page load behavior, resources, geographic differences, and performance trends.
- Real User Monitoring: Collects performance and experience data from actual browsers, devices, locations, pages, and sessions.
- Error Monitoring: Captures JavaScript exceptions, failed requests, broken resources, server errors, and unhandled promises encountered by users.
- Infrastructure And Application Monitoring: Connects website symptoms with services, traces, logs, databases, containers, hosts, and cloud infrastructure.
No single tool is automatically best at all six layers. An uptime check can confirm that a homepage returns HTTP 200 while a checkout button is broken. A browser error tracker can detect that broken button but cannot warn that the whole domain is unreachable if no users can load the tracking script. A serious monitoring plan therefore starts with coverage, not brand names.
Uptime Monitoring Vs. Real User Monitoring
| Method | How It Works | Best At Detecting | Blind Spot |
|---|---|---|---|
| Uptime Monitoring | External Locations Request a URL On a Schedule | Downtime, HTTP Failures, DNS, SSL, And Response Time | May Miss Broken Interactions After the Page Loads |
| Synthetic Monitoring | Automated Browsers Run Defined User Journeys | Login, Search, Forms, Cart, Checkout, And API Workflows | Covers Only the Journeys And Conditions You Script |
| Real User Monitoring | A Script Collects Data From Actual Visits | Real Devices, Browsers, Locations, Pages, And Performance | Needs Real Traffic And Cannot Observe a Fully Unreachable Site |
| Error Tracking | Browser Or Application Events Capture Failures And Context | JavaScript, AJAX, Promise, Resource, And Application Errors | Does Not Replace Independent Availability Checks |
Best Website Monitoring Tools Compared
| Tool | Best For | Core Monitoring Layer | Free Option | Main Limitation |
|---|---|---|---|---|
| Plerdy | Errors Affecting Real Users And Conversions | Client-Side Errors, Sessions, UX, And Behavior | Free Plan And Trial | Not a Synthetic Uptime Checker |
| UptimeRobot | Simple And Affordable Uptime Monitoring | HTTP, Keyword, Port, Ping, SSL, And Status Pages | Yes | Less Diagnostic Depth Than Full-Stack Platforms |
| Site24x7 | All-In-One Website And Infrastructure Monitoring | Uptime, Transactions, RUM, Servers, Cloud, And Networks | Trial And Limited Free Options | Broad Feature Set Requires Configuration |
| Pingdom | Established Uptime And Performance Monitoring | Synthetic Uptime, Transactions, Page Speed, And RUM | Trial | Separate Capabilities And Usage Can Increase Cost |
| Better Stack | Monitoring With Incident Response And Status Pages | Uptime, Heartbeats, Calls, Escalation, And Logs | Yes | Deep Application Diagnostics May Need Other Products |
| Checkly | Developer-Led Synthetic Browser And API Testing | Playwright, API Checks, Monitoring As Code, And Alerts | Trial Or Entry Plan | Best Value Requires Engineering Ownership |
| Datadog | Complex Cloud And Application Environments | Synthetics, RUM, APM, Logs, Infrastructure, And Security | Trial | Cost And Complexity Grow With Telemetry Volume |
| New Relic | Full-Stack Observability And Application Teams | Synthetics, Browser Monitoring, APM, Logs, And Traces | Yes | Can Be Excessive For Basic Website Uptime |
| Sematext | Synthetic And Real User Performance Monitoring | Uptime, Browser Journeys, Page Speed, RUM, Logs, And Infra | Trial | Requires Careful Product And Usage Selection |
| Uptime.com | Business-Critical Availability Monitoring | Uptime, Transactions, APIs, Status Pages, And Escalation | Trial | Advanced Coverage Targets Paid Teams |
| Uptrends | Global Synthetic Monitoring And Transactions | Uptime, Web Performance, APIs, RUM, And Browser Checks | Trial | Configuration And Pricing Depend On Monitor Type |
| StatusCake | Small Teams Needing Essential Monitoring | Uptime, Page Speed, SSL, Domain, And Server Monitoring | Yes | Less Full-Stack Context Than Enterprise Observability Suites |
Pricing Note: Website monitoring software is commonly priced by check frequency, monitor count, monitoring locations, synthetic runs, data volume, users, retention, and incident-response features. Vendors change limits frequently. Confirm current prices and included features on the official product pages before purchasing.
How We Evaluated Website Monitoring Software
We evaluated each website monitoring tool against the job it is designed to perform. A basic uptime monitor should not lose points for lacking enterprise traces, and a full observability platform should not rank first merely because it has the longest feature list.
- Coverage: HTTP, HTTPS, DNS, SSL, ports, APIs, transactions, page speed, RUM, errors, servers, cloud services, and networks.
- Detection Quality: Check frequency, global locations, retries, validation rules, false-positive controls, and dependency awareness.
- Diagnostic Context: Response details, screenshots, waterfall data, traces, logs, browser context, affected sessions, and last user actions.
- Transaction Monitoring: Ability to test login, search, forms, shopping carts, checkout, payments, and other multi-step journeys.
- Alerting: Email, SMS, phone, push, Slack, Microsoft Teams, PagerDuty, Opsgenie, webhooks, schedules, and escalation rules.
- Incident Workflow: Ownership, acknowledgment, on-call schedules, status pages, postmortems, and collaboration.
- Usability: Setup effort, dashboard clarity, maintenance, reporting, and accessibility for the intended team.
- Integrations: Deployment tools, issue trackers, observability stacks, communication tools, APIs, and data exports.
- Total Cost: Subscription, usage, retention, implementation, maintenance, and engineering time.
A platform received a stronger position when its advantage was clear for a defined use case and its limitations could be stated honestly. Website monitoring is too broad for one credible universal winner.
Best Website Monitoring Tools Reviews
1. Plerdy — Best For Real-User Errors And Conversion Impact
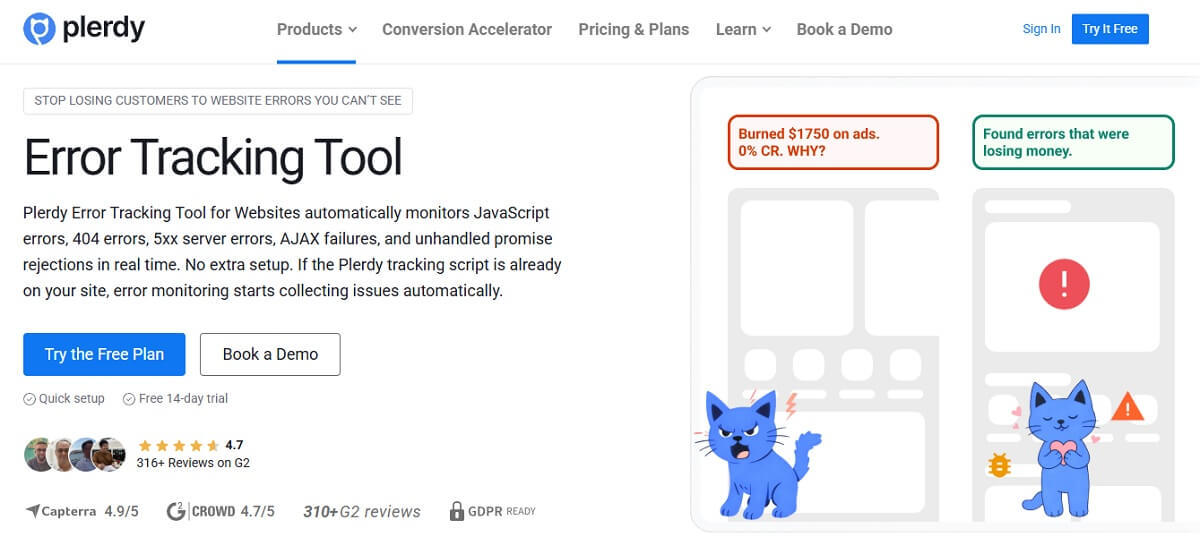
Plerdy Error Tracking automatically captures client-side JavaScript errors, unhandled promise rejections, failed AJAX requests, missing 404 resources, and 5xx responses encountered on monitored pages. Each issue can include the error message, file, line and column, URL, browser, device, operating system, affected sessions, affected pages, and the last recorded visitor action.
Best For: Ecommerce, SaaS, lead-generation, product, CRO, UX, and QA teams that need to prioritize errors by user and revenue impact.
Why It Stands Out: Technical logs tell developers what failed. Plerdy connects that failure with what the visitor was doing and can complement it with session replay, heatmaps, events, funnels, and ecommerce analytics. A team can identify that a checkout error affected mobile Safari users, inspect the sessions, and estimate which conversion path is being lost.
Limitations: Plerdy does not independently ping an unavailable domain from global locations and should not be described as a replacement for website uptime monitoring. Pair it with UptimeRobot, Site24x7, Pingdom, Better Stack, or another external monitor.
2. UptimeRobot — Best For Simple Uptime Monitoring
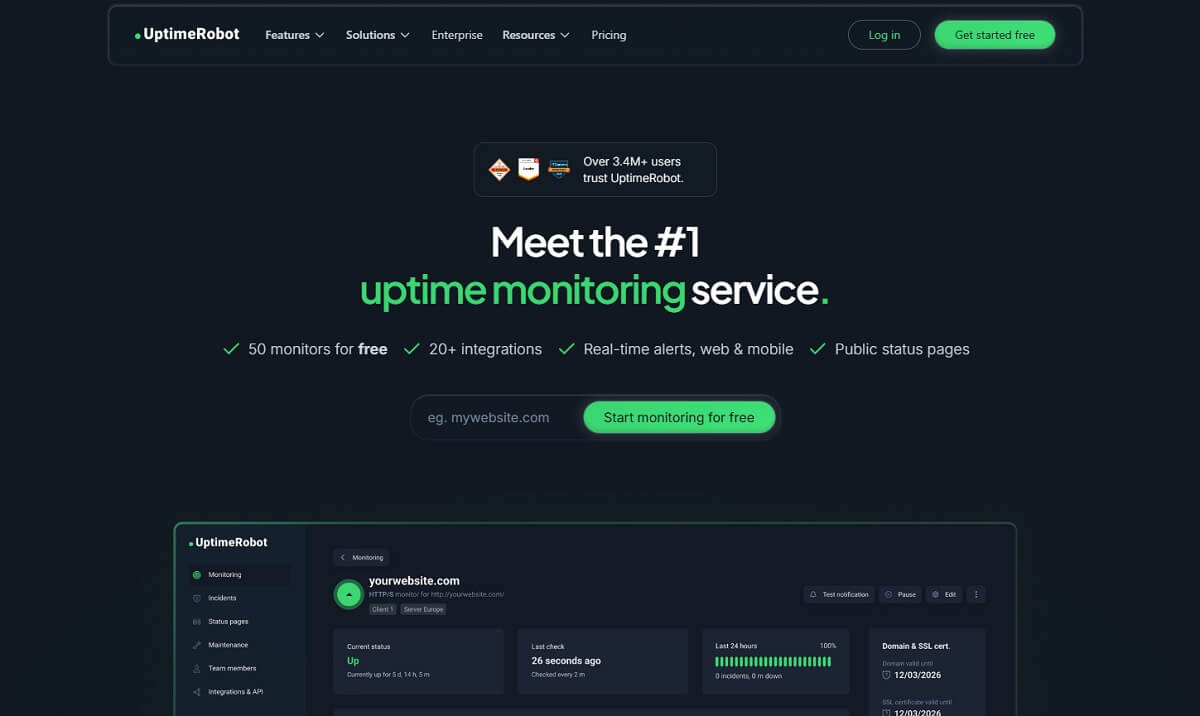
UptimeRobot focuses on straightforward monitoring for websites and internet services, with HTTP checks, keyword checks, ports, ping, SSL monitoring, alerts, maintenance windows, and status pages.
Best For: Freelancers, small businesses, agencies, and teams that want quick website uptime monitoring without deploying a large observability stack.
Why It Stands Out: Setup is approachable, a free option is available, and common availability checks can be configured quickly. It is a practical first monitor for a business that currently relies on customers to report downtime.
Limitations: Basic checks do not automatically explain a complex application failure or show what a real user did before an error. Add transaction, RUM, error, or application monitoring where the business risk requires it.
3. Site24x7 — Best All-In-One Website Monitoring Platform
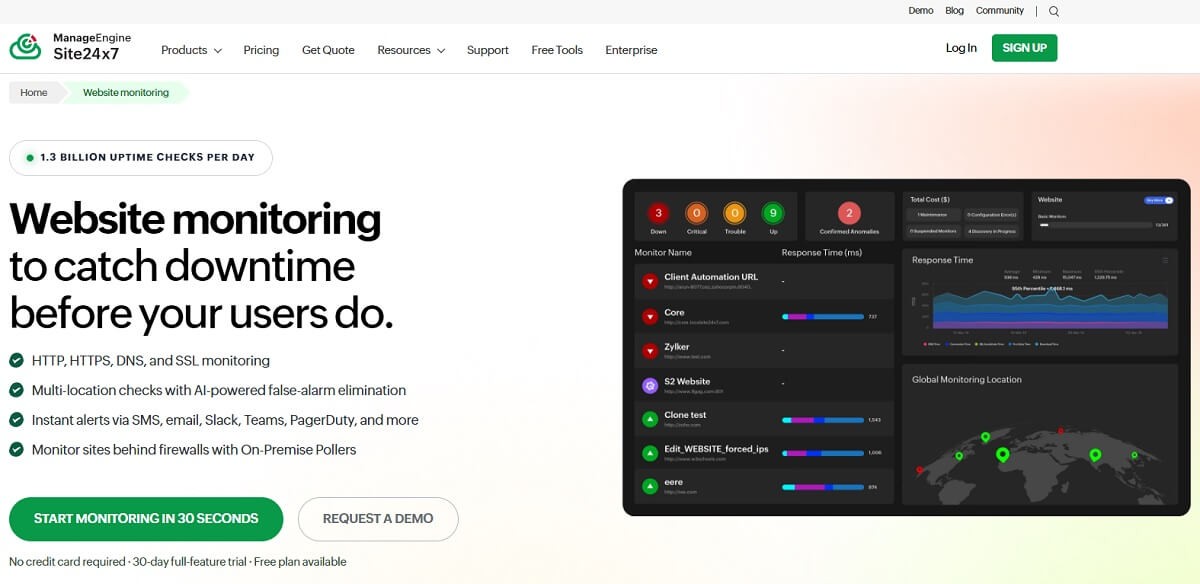
Site24x7 Website Monitoring covers websites, synthetic browser transactions, real user monitoring, servers, applications, networks, cloud platforms, logs, and digital experience monitoring.
Best For: Organizations that want broad coverage from one vendor rather than assembling several narrow tools.
Why It Stands Out: Teams can connect a visible website problem with deeper application, server, network, or cloud signals. Global monitoring locations and scripted workflows support more than a basic homepage ping.
Limitations: Breadth creates setup decisions. Teams should begin with their critical services and journeys instead of enabling every monitor and generating noisy alerts.
4. Pingdom — Best For Established Uptime And Performance Monitoring
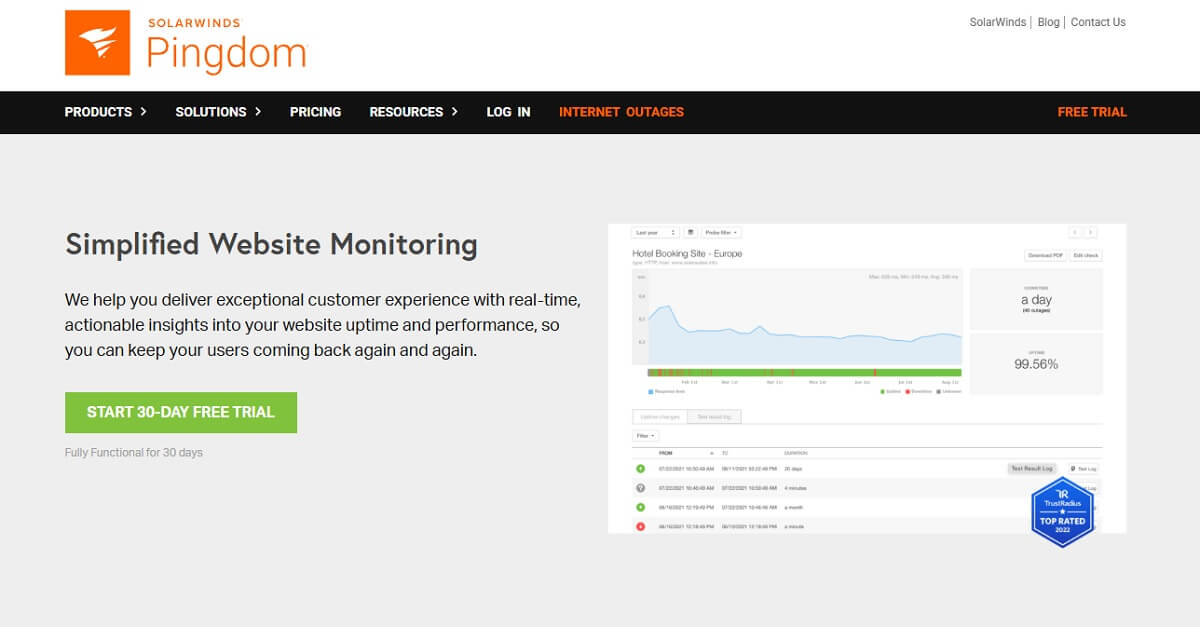
Pingdom combines uptime monitoring, page-speed analysis, transaction monitoring, and real user monitoring.
Best For: Marketing, ecommerce, operations, and web teams that need recognizable availability and performance reporting.
Why It Stands Out: Synthetic and real-user views help teams compare controlled tests with actual visitor performance. Transaction checks can verify workflows that a simple response-code monitor cannot.
Limitations: Confirm how monitors, check intervals, retention, RUM pageviews, and advanced features affect the current plan cost. Deeper application diagnostics may require additional tooling.
5.Stack — Best For Monitoring And Incident Response
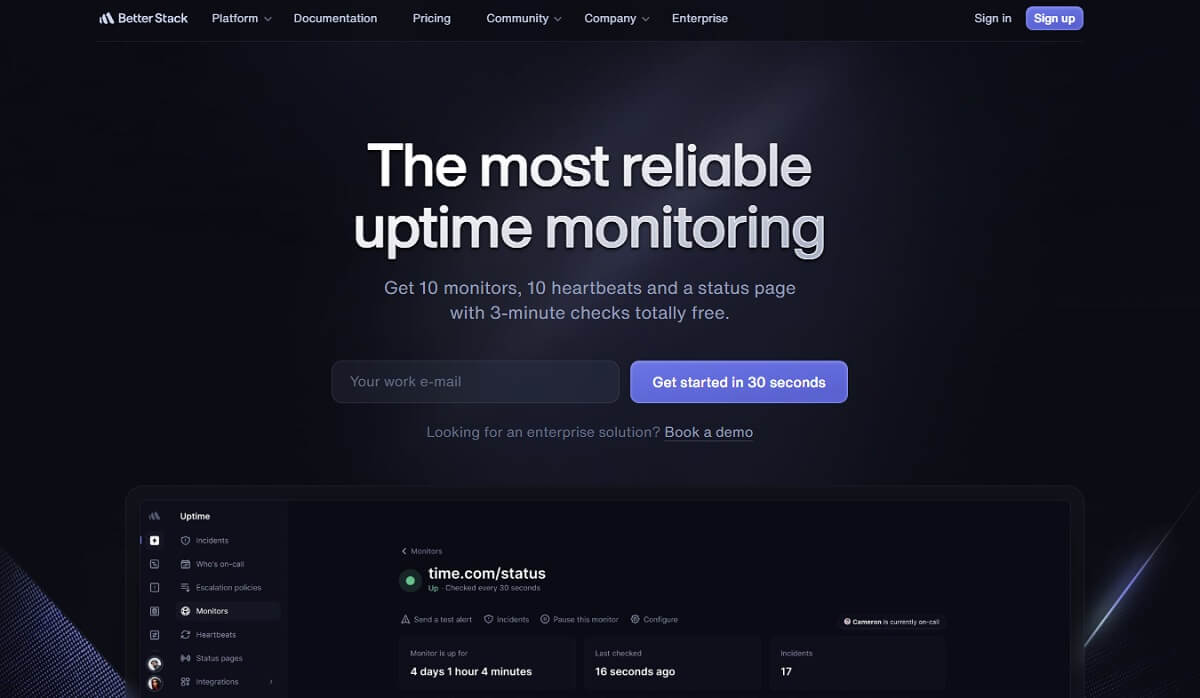
Better Stack Uptime combines website and service checks with on-call scheduling, phone and SMS escalation, status pages, incident management, heartbeats, and integrations.
Best For: Startups and engineering teams that need both detection and a clear response workflow.
Why It Stands Out: An alert is useful only when it reaches the right person and is acknowledged. Better Stack places incident response close to uptime monitoring, reducing the need to assemble several services for smaller teams.
Limitations: Organizations needing detailed frontend behavior, complex distributed tracing, or specialized ecommerce diagnostics may still pair it with other products.
6. Checkly — Best For Developer-Led Synthetic Monitoring
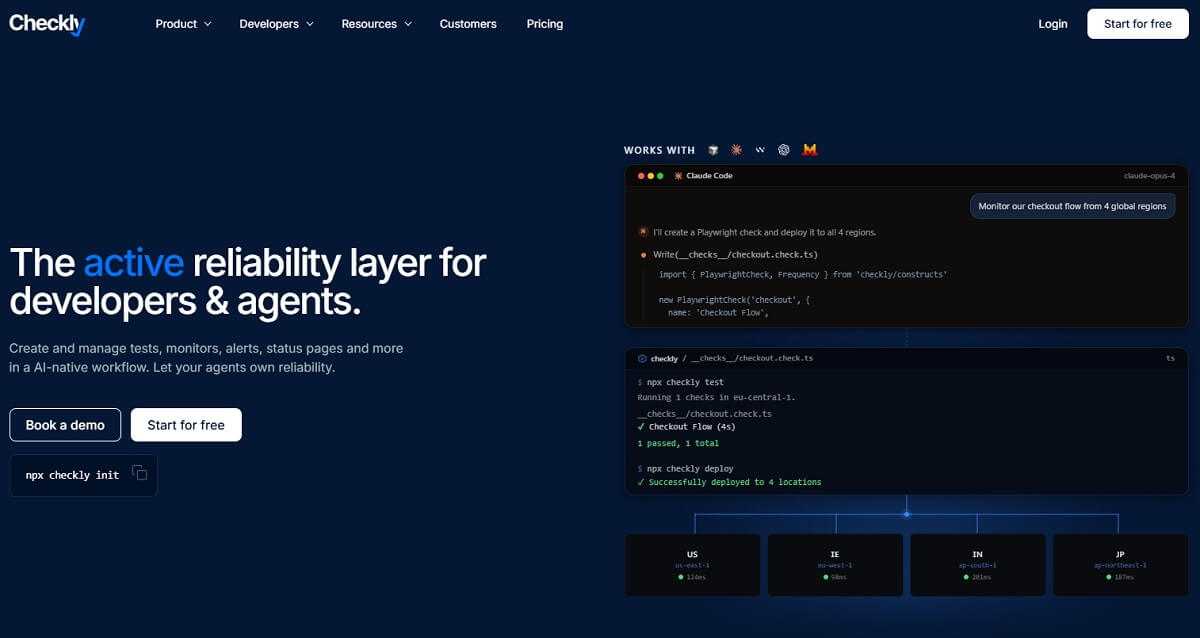
Checkly is built around API checks, browser checks, Playwright, monitoring as code, deployment workflows, and programmable assertions.
Best For: Engineering teams that want production monitoring to use the same browser-testing skills and version-control workflows as development.
Why It Stands Out: Playwright-based checks can verify realistic journeys and be managed alongside application code. This supports review, reuse, automated deployment, and clearer ownership.
Limitations: Checkly is less approachable for nontechnical owners who only need a basic uptime alert. Scripted tests also require maintenance whenever the monitored interface changes.
7. Datadog — Best For Enterprise Cloud Observability
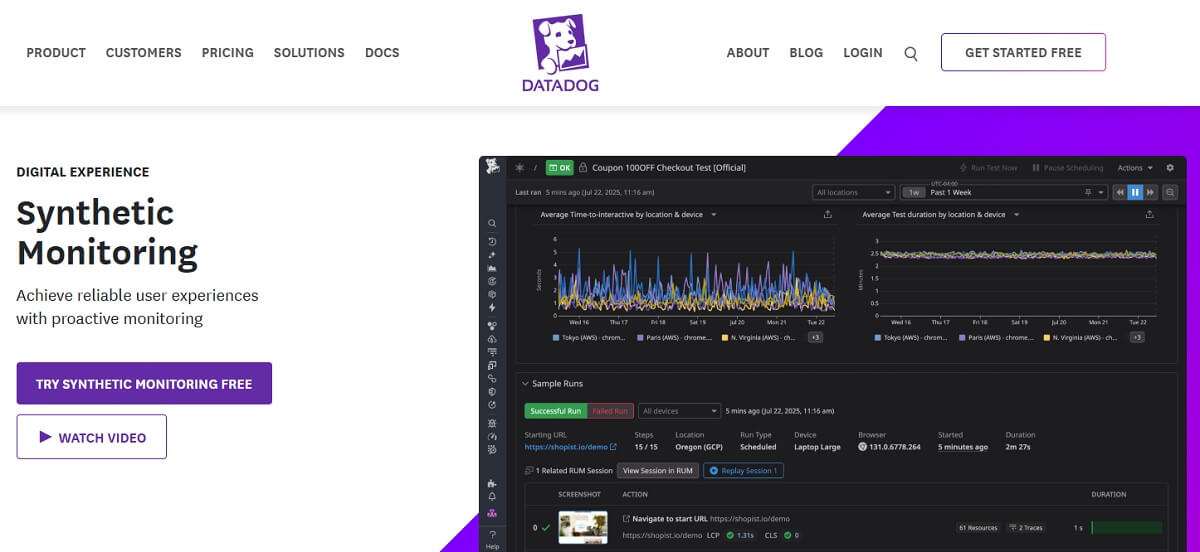
Datadog Synthetic Monitoring works within a larger platform covering real user monitoring, application performance, infrastructure, logs, traces, security, networks, databases, and cloud services.
Best For: Enterprises and technical organizations already operating complex cloud and microservice environments.
Why It Stands Out: A failed website transaction can be connected with backend traces, service dependencies, infrastructure metrics, deployments, and logs. This makes diagnosis faster when the visible failure is only a symptom.
Limitations: Datadog can be expensive and operationally heavy when telemetry volume, teams, retention, and products expand. Estimate total usage with representative production data before committing.
8. New Relic — Best For Full-Stack Application Monitoring
New Relic Synthetic Monitoring combines browser and API checks with browser monitoring, APM, logs, infrastructure signals, distributed tracing, and alerts.
Best For: Software and operations teams that need to move from a failed page or journey into application-level diagnosis.
Why It Stands Out: Synthetic checks can be interpreted within a broader observability environment rather than as isolated uptime alerts. A free entry option can also make evaluation easier.
Limitations: The interface, query model, telemetry, and pricing require learning and governance. A small brochure website may receive more value from a simpler monitoring service.
9. Sematext — Best For Synthetic And Real User Performance

Sematext Synthetics supports uptime, APIs, browser journeys, performance checks, screenshots, and private locations and can be used alongside Sematext Experience, logs, and infrastructure monitoring.
Best For: Teams that want synthetic website performance monitoring tools and real user performance data in a connected ecosystem.
Why It Stands Out: Browser checks can verify important workflows, while real-user data helps expose conditions that controlled tests do not reproduce.
Limitations: Teams need to decide which Sematext products, volumes, and retention periods are necessary. It is not as simple as a single free uptime monitor.
10. Uptime.com — Best For Business-Critical Availability
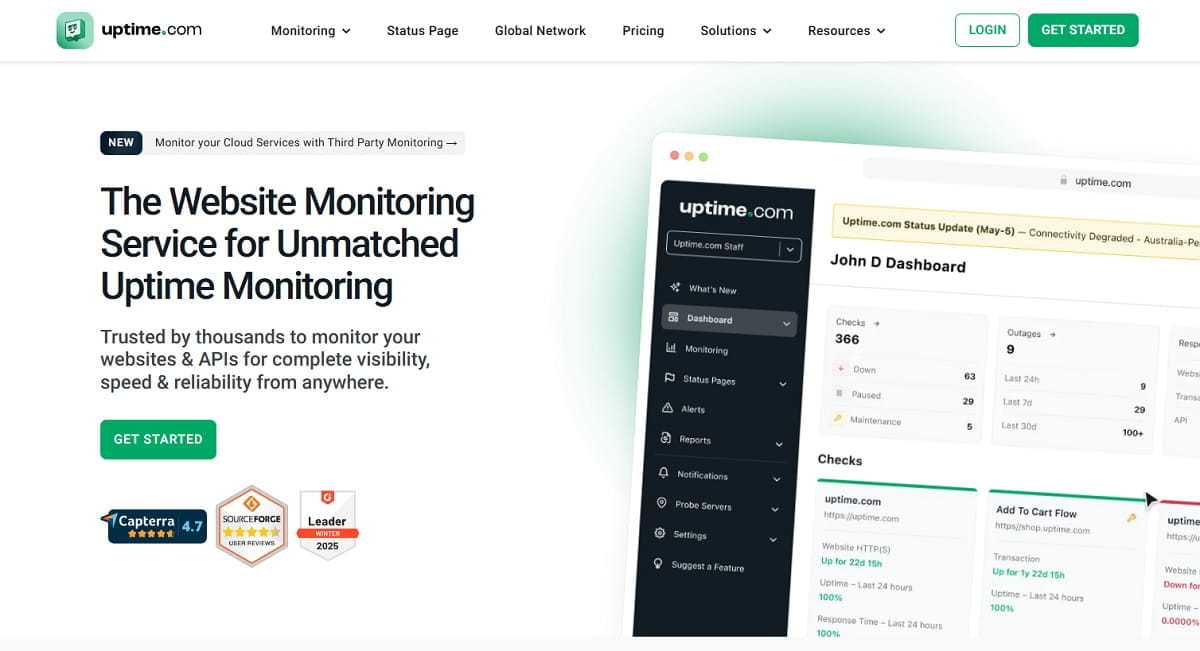
Uptime.com provides uptime, transaction, API, real user, private-location, status-page, and alerting capabilities for business websites and services.
Best For: Organizations that treat website availability as an operational commitment and need controlled checks, reporting, and escalation.
Why It Stands Out: The platform is oriented toward structured monitoring programs rather than only casual checks. It can cover public websites, APIs, and multi-step transactions.
Limitations: Advanced capabilities and higher monitoring requirements belong to paid plans. Smaller sites should compare the additional value with simpler alternatives.
11. Uptrends — Best For Global Synthetic Transactions
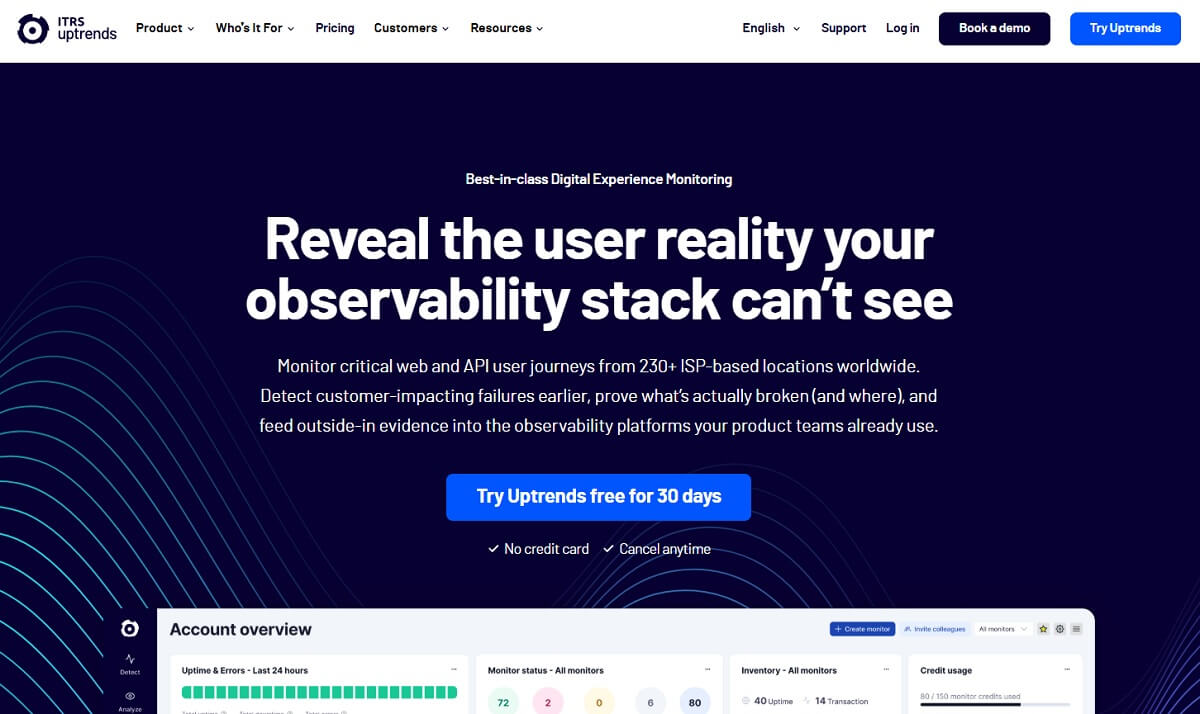
Uptrends covers uptime, web performance, browser transactions, APIs, real user monitoring, private checkpoints, and public or private status reporting.
Best For: International websites and ecommerce teams that need controlled tests from multiple locations and browsers.
Why It Stands Out: Teams can monitor both simple endpoints and multi-step browser journeys from a broad geographic network.
Limitations: Monitor types, frequencies, locations, and user requirements influence the final setup and price. Transaction scripts must be maintained as flows change.
12. StatusCake — Best For Essential Monitoring On a Budget
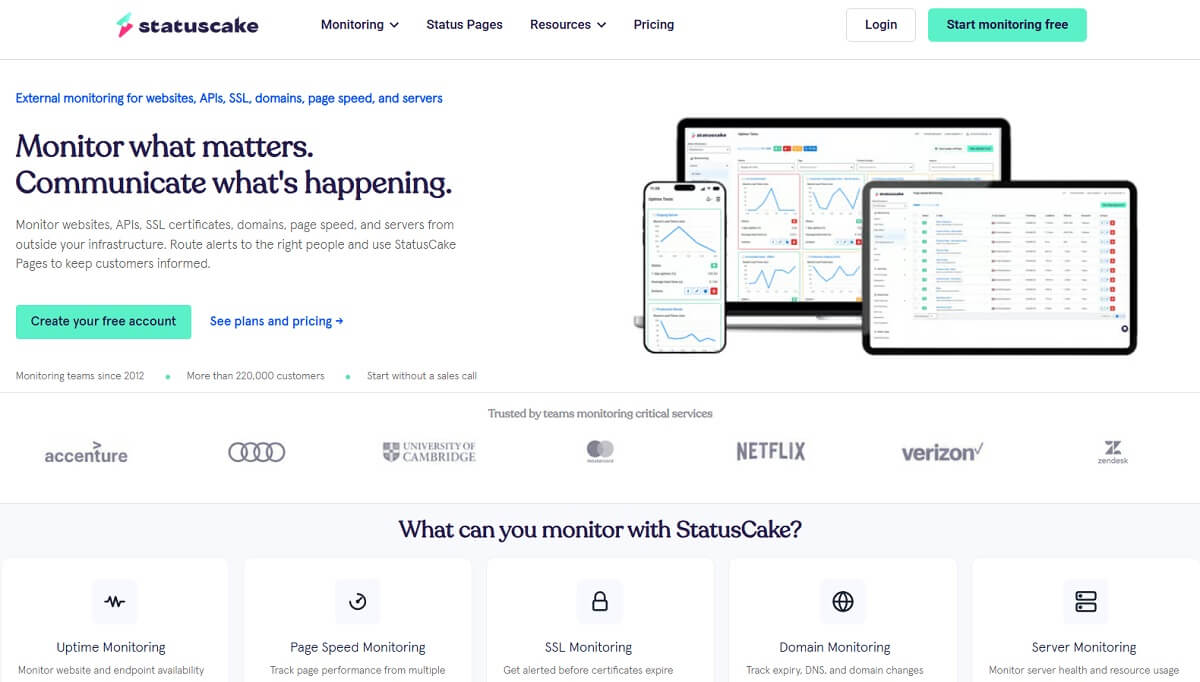
StatusCake offers uptime checks alongside page-speed, SSL, domain, and server monitoring.
Best For: Small businesses, agencies, and side projects that need accessible monitoring across several essential website risks.
Why It Stands Out: A free option and focused monitoring categories make it easier to start without adopting a full observability platform.
Limitations: Deep transaction debugging, distributed tracing, behavioral analytics, and conversion context require other tools.
Where Error Tracking Fits
The primary search intent behind website monitoring tools is availability and performance. Error tracking tools address a related but distinct layer: failures that occur after HTML begins loading or while visitors interact with the interface. These phrases belong in this article because a complete monitoring strategy needs both layers, but they should not replace the primary uptime-focused structure.
Website error tracking tools capture browser and application failures such as JavaScript exceptions, failed API requests, broken resources, unhandled promises, and server responses seen by users. JavaScript error tracking tools may also provide stack traces, source maps, breadcrumbs, releases, affected users, and alerting. Frontend error monitoring tools become particularly valuable for single-page applications, ecommerce checkouts, dashboards, forms, configurators, and other interaction-heavy websites.
Browser error events have different technical paths. For example, MDN documents the browser’s Window error event for script errors and the unhandledrejection event for rejected promises without handlers. Reliable client-side error tracking needs to capture, group, filter, and contextualize these signals without collecting unnecessary personal data.
Uptime Monitoring And Error Tracking Compared
| Failure | Uptime Monitor | Error Tracker | Recommended Coverage |
|---|---|---|---|
| Domain Is Completely Unreachable | Detects It From External Locations | Cannot Load Its Browser Script | External Uptime Monitoring |
| Homepage Returns HTTP 500 | Detects the Failed Response | May Record the Response If the Script Loaded Earlier | Use Both |
| Add-To-Cart Button Throws a JavaScript Error | Basic Check May Still Report HTTP 200 | Captures the Error And User Context | Error Tracking Plus Synthetic Checkout |
| Checkout Works In Chrome But Fails In Mobile Safari | Detects It Only If That Environment Is Tested | Segments Real Failures By Browser And Device | Real-User Error Monitoring |
| API Request Fails For a User Segment | API Monitor Tests Defined Conditions | Captures Failed AJAX Or Fetch Activity In Real Sessions | Use Both |
| Page Is Available But Very Slow | Synthetic Performance Check Detects a Trend | May Show Related Errors But Not Full Performance Context | Synthetic Plus Real User Monitoring |
Which Error Tracking Tool Should You Add?
- Plerdy is best when website errors need session, device, last-action, UX, funnel, and conversion context.
- Sentry is best for engineering teams needing deep multi-language error tracking, releases, source maps, traces, and developer integrations.
- LogRocket is best for frontend debugging that combines session replay with console, network, state, and performance context.
- Bugsnag is strong for application stability and teams monitoring web and mobile releases.
- Rollbar fits teams that need error grouping, deployment context, alerts, and developer workflows.
A dedicated website error monitoring software product may provide deeper code diagnostics than a business-focused analytics platform. Conversely, technical stack traces alone may not reveal whether the error blocked a purchase or affected only a rarely used decorative component. Select the depth that matches the owner and decision.
How To Choose a Website Monitoring Tool
Start With Critical User Journeys
List the website actions that create or protect value. Examples include opening the homepage, searching, signing in, submitting a lead form, adding a product to the cart, completing checkout, accessing an account, and calling an API. Monitoring should prove that these journeys work, not merely that the server responds.
Define Detection And Response Targets
Specify how quickly each failure must be detected, who should receive the alert, when escalation begins, and what evidence is needed to diagnose it. A five-minute check may be appropriate for a small brochure site but unacceptable for a high-volume checkout.
Combine External And Real User Coverage
Use an external website monitoring service for availability, SSL, DNS, APIs, and synthetic workflows. Add real-user monitoring or client-side error tracking for browsers, devices, actual sessions, and interaction failures. This reduces the blind spots created by relying on only one measurement method.
Control Alert Noise
Configure confirmation checks, location thresholds, maintenance windows, dependency rules, severity, deduplication, and routing. If every alert is urgent, teams eventually treat none of them as urgent.
Calculate the Total Cost
Include check volume, frequency, global locations, synthetic browser runs, RUM traffic, telemetry retention, seats, SMS or phone alerts, status pages, private locations, implementation, and ongoing maintenance. Test with representative production volume before comparing plans.
Run a Realistic Pilot
Monitor one production service and one business-critical transaction. Create controlled failures, verify detection, inspect diagnostic context, test escalation, and measure time to acknowledgment and resolution. A dashboard demo does not prove that the tool will help during an actual incident.
Website Monitoring Metrics To Track
| Metric | What It Measures | Practical Use |
|---|---|---|
| Availability | Percentage Of Successful Monitoring Checks | Track Reliability Against the Defined Objective |
| Response Time | Time Until the Monitored Endpoint Responds | Detect Slowdowns And Geographic Differences |
| Transaction Success Rate | Percentage Of Completed Synthetic Journeys | Monitor Login, Forms, Cart, And Checkout |
| Mean Time To Detect | Time Between Failure And Detection | Evaluate Check Frequency And Coverage |
| Mean Time To Acknowledge | Time Between Alert And Human Acknowledgment | Evaluate Routing And On-Call Response |
| Mean Time To Resolve | Time Between Failure And Recovery | Evaluate the Complete Incident Workflow |
| Error-Affected Sessions | Real Sessions Experiencing a Tracked Error | Prioritize Issues By User Impact |
| Conversion-Blocking Errors | Errors On Critical Funnel Actions Or Pages | Prioritize Fixes By Revenue Risk |
| False Alert Rate | Alerts That Do Not Represent an Actionable Failure | Protect Trust In the Monitoring System |
Website Monitoring Implementation Plan
Week One: Map And Prioritize
- Inventory domains, subdomains, APIs, certificates, DNS records, third-party dependencies, and critical pages.
- Map business-critical journeys and assign a business owner to each one.
- Define severity levels, detection targets, response targets, and escalation paths.
- Select the smallest monitoring stack that covers uptime, transactions, performance, and real-user errors.
Week Two: Configure And Integrate
- Create external HTTP, SSL, DNS, API, and transaction checks.
- Install approved RUM and error-monitoring scripts with appropriate consent and data controls.
- Connect Slack, Microsoft Teams, PagerDuty, Opsgenie, email, SMS, webhooks, or other response channels.
- Create public or internal status pages where appropriate.
Week Three: Test Failures
- Return a controlled failed status from a test endpoint.
- Break a synthetic selector and verify that transaction monitoring detects the failure.
- Trigger a safe test JavaScript error and confirm the browser, page, session, and action context.
- Test alert acknowledgment, backup contacts, maintenance windows, and recovery notifications.
- Verify that sensitive input and personal data are excluded or masked.
Week Four: Operate And Improve
- Remove noisy or duplicated alerts and document known dependencies.
- Publish an ownership matrix and short incident playbooks.
- Review uptime, transaction success, affected sessions, and response metrics weekly.
- Run a monthly controlled test and a quarterly coverage review.
Common Website Monitoring Mistakes
- Monitoring Only the Homepage: The homepage can work while login, search, forms, APIs, cart, or checkout fails.
- Treating HTTP 200 As Success: A successful response does not prove that the correct content or interaction works.
- Using Only One Monitoring Location: Regional DNS, CDN, routing, or infrastructure failures may remain invisible.
- Ignoring Real Users: Synthetic checks cannot reproduce every browser, device, extension, network, and behavior pattern.
- Ignoring Error Tracking: A page can remain available while JavaScript and AJAX failures quietly block conversions.
- Creating Too Many Alerts: Unprioritized noise produces alert fatigue and slower responses.
- Not Testing Notifications: An alert configuration is not reliable until the complete escalation path is tested.
- Forgetting Maintenance Windows: Planned work creates false incidents and trains teams to ignore messages.
- Monitoring Without Ownership: Detection has little value when nobody is responsible for acknowledgment and resolution.
- Never Updating Synthetic Journeys: Interface changes can break the monitor instead of the customer journey.
- Exposing Sensitive Data: Screenshots, logs, request bodies, URLs, and recordings require privacy and access controls.
- Choosing Tools Before Defining Risk: Feature comparisons are meaningless without critical journeys and response requirements.
Final Recommendation
The best website monitoring tools depend on what must be detected and who will respond. Choose UptimeRobot or StatusCake for an accessible uptime baseline. Choose Site24x7 or Pingdom for broader website monitoring. Choose Better Stack when incident response and status communication matter. Choose Checkly for developer-managed synthetic testing. Choose Datadog or New Relic for complex full-stack observability. Choose Plerdy when the priority is identifying website errors that affect real sessions, user behavior, funnels, and conversions.
For most commercial websites, the strongest setup is not one oversized platform. It is a controlled combination: external website uptime monitoring, one synthetic critical journey, real-user performance data, and client-side error tracking connected to business impact. Start with the checkout, signup, or lead flow that matters most, verify the alerts through a controlled failure, and expand only when a specific risk justifies another monitor.
Frequently Asked Questions
What Are Website Monitoring Tools?
Website monitoring tools check a website’s availability, response time, certificates, APIs, transactions, performance, real-user experience, or application errors. They alert responsible teams when a monitored condition fails and provide evidence for diagnosis.
What Is the Best Website Monitoring Tool?
The best tool depends on the monitoring layer. UptimeRobot is a practical choice for simple uptime, Site24x7 for broad all-in-one coverage, Better Stack for incident response, Checkly for developer-led browser checks, Datadog for complex observability, and Plerdy for real-user errors and conversion context.
How Does Website Monitoring Work?
External monitors request a website, service, API, or scripted browser journey on a schedule and validate the response. Real-user monitoring and error tracking collect approved telemetry from actual browsers. Alerts are sent when defined availability, performance, transaction, or error conditions fail.
What Is Website Uptime Monitoring?
Website uptime monitoring checks whether a website or service is reachable and responding as expected. A monitor may validate HTTP status, response content, DNS, ports, SSL certificates, or APIs from one or more geographic locations.
What Is the Difference Between Uptime Monitoring And Error Tracking?
Uptime monitoring checks a website externally and can detect when it is unavailable. Error tracking captures code, request, or resource failures that occur while real users interact with the website. A complete setup uses uptime monitoring for reachability and error tracking for failures that happen after the page starts loading.
Can Plerdy Monitor Website Uptime?
Plerdy should not be positioned as a synthetic uptime checker. It monitors errors encountered on tracked websites and connects them with affected users, sessions, pages, devices, browsers, and visitor actions. Pair Plerdy with an external uptime monitor for complete availability and real-user error coverage.
How Often Should a Website Be Monitored?
Monitoring frequency should reflect business risk. High-volume checkouts, APIs, and customer portals may need checks every minute or more often, while a small informational website may accept longer intervals. The target detection time should determine the frequency.
What Should Website Monitoring Include?
At minimum, monitor the primary domain, SSL certificate, DNS, critical APIs, and one business-critical journey such as signup, form submission, login, or checkout. Commercial sites should also consider real-user performance, JavaScript errors, failed requests, 404 resources, and incident escalation.
Are Free Website Monitoring Tools Enough?
A free tool may be enough for basic uptime monitoring on a small site. Paid plans become valuable when the business needs faster checks, more locations, transaction monitoring, private monitors, longer retention, advanced alerts, status pages, multiple users, or deeper diagnostics.