
Recently, we have asked 36 UX specialists to share how they use heatmaps for user experience (UX) research. They have told us what user experience statistics they collect and what data they rely on. The Plerdy team has turned their responses into 26 statistics on user experience (UX) research approaches.
Check our findings to understand popular UX research best practices and apply them in your company. You will discover:
- Website elements UX specialists analyze
- Types of UX statistics collected
- UX statistics experts ignore
We ran the survey in August-September 2022. It aimed to identify UX Research Statistics and how experts from different niches approach user experience analysis.
26 UX (User Experience) Research Statistics
Below are 26 UX research statistics collected in our survey. We grouped the research results into several categories by data type.
First click tracking for User Experience
First clicks show what grasps visitors’ attention once they land on website pages. A person needs a fraction of a second to start navigation. Hence, the place where it starts browsing your website is crucial, and you must track it.
- 69% of UX specialists analyze the first click on the website
- 13.8% don’t check where people click website pages for the first time
- 17.2% would like to record first clicks but don’t have tools for such research
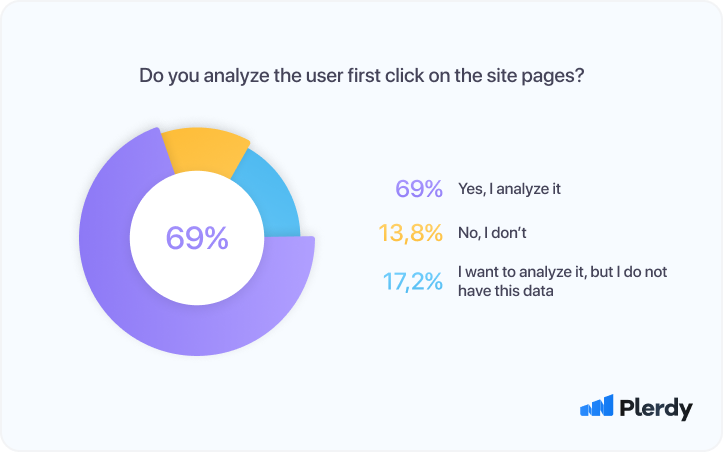
Why does the first interaction matter? With these research statistics, you can detect the best place to add website elements that generate conversions. For example, if you notice that most users click a banner at the top left, replacing it with the Order Now button may be better. And, vice versa, once you notice that some elements get no attention, you may decide to move or delete them for an optimized user experience.
Traffic segmentation by channel for User Experience
Most responders do not segment activity based on the traffic channel. As a result, they may lack important insight into the differences between the main target groups:
- 37.9% of respondents claim they segment heatmap user experience data by traffic channel
- 44.8% don’t use traffic segmentation to analyze UX
- 17.2% would like to segment such statistics but don’t have it
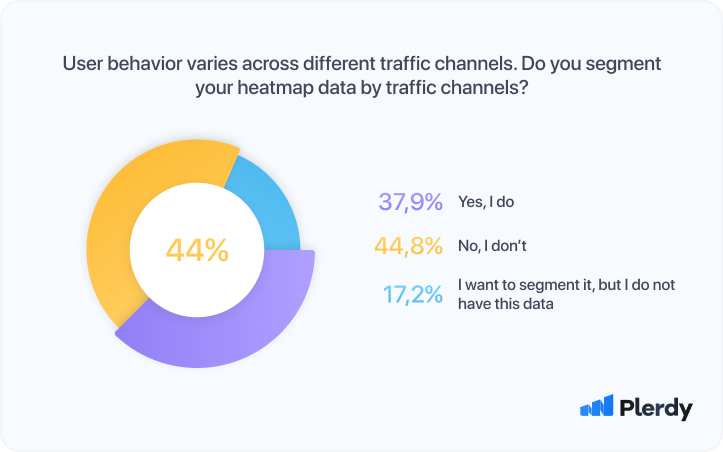
Traffic data segmentation is an excellent way to check how people behave depending on where they come from. Organic traffic visitors may have different behavioral patterns and UX expectations than those coming from referral channels. Such research helps you adapt the user experience to the target audience generating the most profit.
Clicks on dynamic elements (pop-ups, sliders, tabs)
Dynamic elements are banners, sliders, and pop-ups that engage leads and boost conversion. Even though only some research participants track dynamic elements, these interactions are no less important as they show the real picture of user experience.
- 58.6% of UX specialists analyze clicks on dynamic website elements
- 24.1% don’t use the information on dynamic clicks
- 17.2% want to analyze dynamic interactions but lack the necessary data
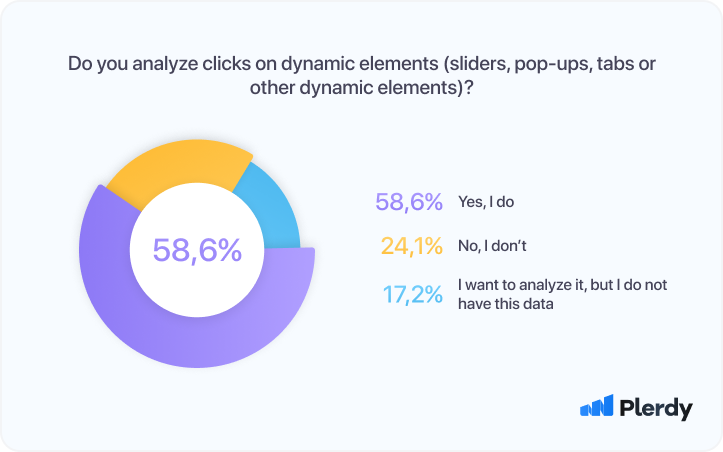
With this data, the information on user interactions is complete and accurate. It makes a particularly significant difference if a website has many dynamic elements.
Website page scroll depth for User Experience
A high percentage of respondents use scroll maps to check their website pages. This information is beneficial to evaluate content quality. If you detect that people abandon your articles too soon, your content may be too long or not interesting enough.
- 65.5% of UX experts analyze the scroll depth on website pages
- 27.6% don’t check how far visitors scroll
- 6.9% of user experience professionals would like to use this data but don’t have it
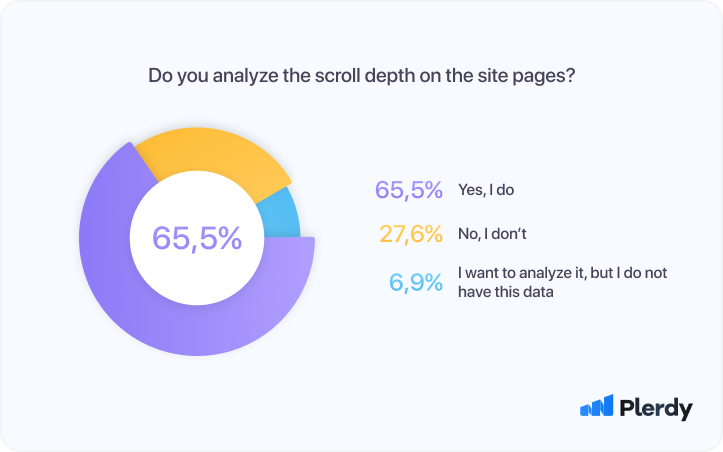
Scroll-depth research also allows user experience specialists to determine whether visitors see the elements in the footer. If you have critical buttons at the bottom, you’d better put them somewhere higher.
A separate analysis of scroll depth and mouse movements
On large screens, users navigate with a cursor instead of scrolling. The users of devices with small screens, contrarily, may not use mouse navigation. Therefore, UX specialists must check scrolls and cursor movements separately.
- Only 31% of survey participants separately analyze scrolling depth and cursor movements for large screens
- 34.5% of UX analysts don’t gather data on scrolls and mouse movements apart
- 34.5% want to investigate it but lack such data
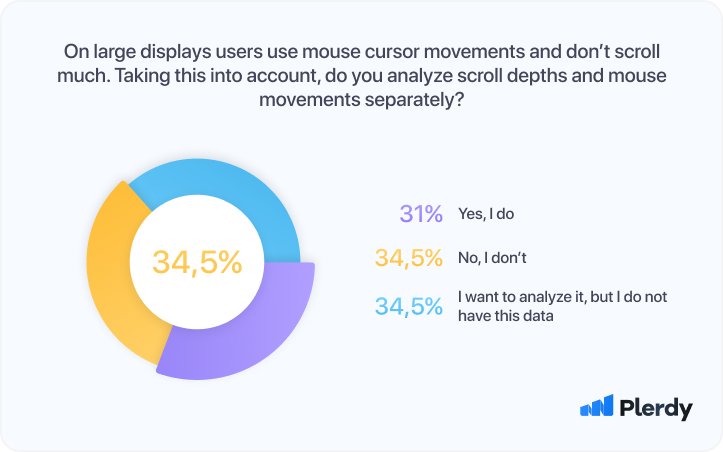
You may get incorrect information about your users’ experience without separating these data types. As a result, your designers or marketers risk making the wrong decisions about what changes are required.
A separate analysis of logged-in and new users
Users who have already committed to your brand by creating an account will likely behave differently. This group may have a shorter conversion path and make fewer additional interactions. That’s why UX specialists must differentiate between existing leads and newcomers.
- Less than half of the respondents (41.4%) track registered and new users separately
- 34.5% don’t analyze logged-in and new users
- 24.1% would be interested in such details but don’t have them
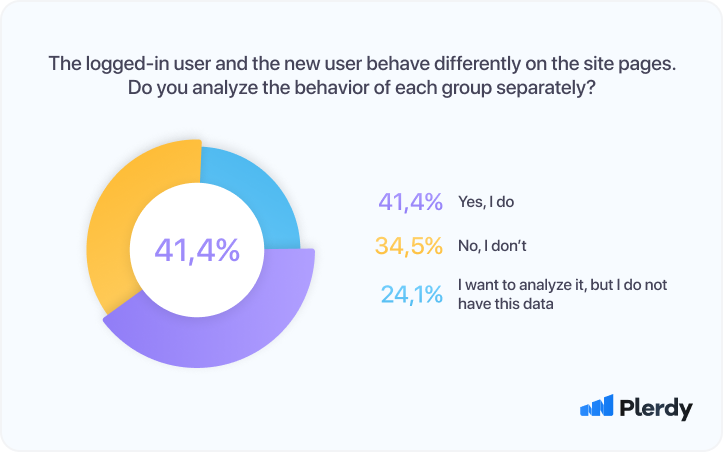
Such analysis allows us to find ways to nurture the loyalty of registered users and optimize the experience of the new ones. You see whether fresh leads have all the information they need.
Click sequence analysis on single web pages with dynamic elements
This user experience research is crucial on websites with many dynamic elements. Users may interact with various sliders or banners before conversion. Hence, you must see what they do step-by-step.
- Only 31% check click sequence on single pages with dynamic elements
- Most UX specialists (41.4%) don’t track it
- 27.6% say they would run this research if they had such user experience statistics
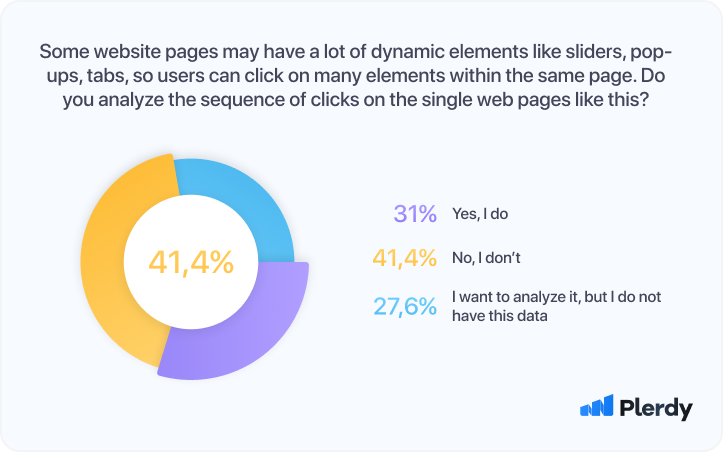
If you don’t record click sequences for dynamic elements, you will just lack a huge share of data. It will make your findings unreliable.
No analysis of click data on empty website areas
Most of our survey participants don’t track clicks on empty website spaces. Only one-fifth of them uses these metrics.
- 20.7% check whether users click on empty website areas
- 75.9% believe there is no need to track this data
- 3.4% want to check clicks on empty spaces but lack this data
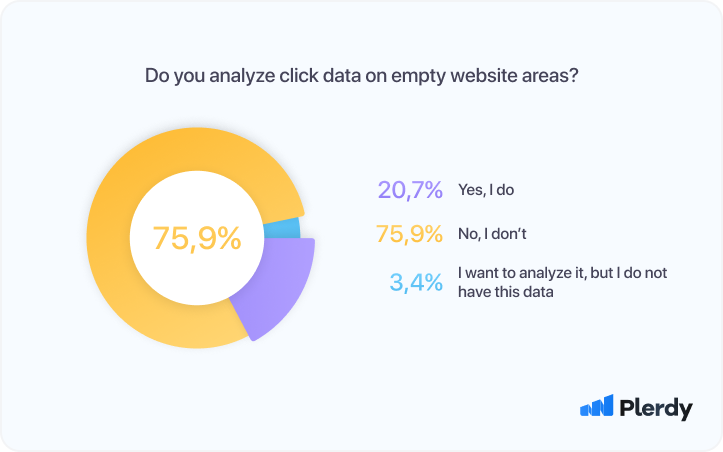
So do you need this data? Generally, UX experts that don’t monitor empty areas are right. This information will tell you a little about user experience. Instead, we recommend gathering rage clicks. These are the clicks that people make when they are frustrated because of poor navigation or other issues.
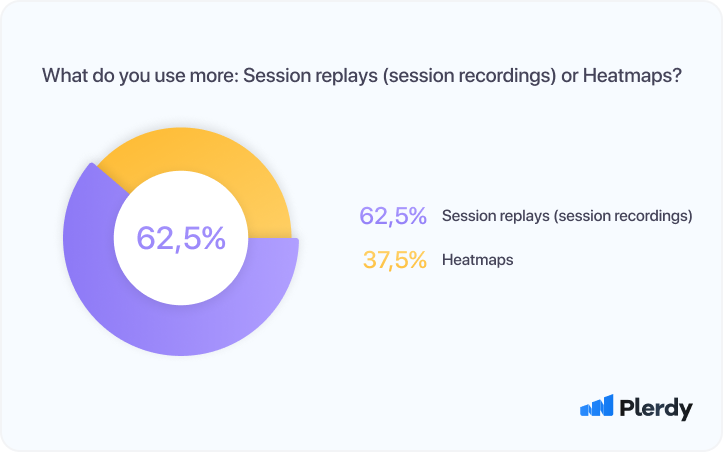
Heatmaps vs. session recordings for User Experience
While heatmaps record specific interactions like clicks, scrolls, or hovers, session recordings capture activity in video format. UX experts usually combine these features for a broader perspective on user experience.
- More than half of UX specialists (62.5%) prefer session recordings over heatmaps
- 37.5% use heatmaps more often than session replays
Both tools are highly effective, even though they represent data differently. An optimum approach is to combine them to get a deeper insight. You can monitor specific user activity to see what elements attract the most attention or remain overlooked with heatmaps. At the same time, you can activate session recordings to view how people navigate your pages as they move through the conversion path.
Above, you’ve familiarized yourself with the 26 UX statistics resulting from our survey. Thus, we’ve identified how experts from different niches approach UX analysis. We hope that you will find these statistics valuable when planning your own approach to UX.
Conclusions User Experience (UX) Research Statistics
User experience (UX) analysis requires a custom approach. Yet, there are some tried and tested methods to follow. This overview illustrates how other specialists analyze their websites to guide you. You can start using Plerdy now to conduct research yourself.